|
Download Data (XLS File) |
|
||||||||
|
||||||||
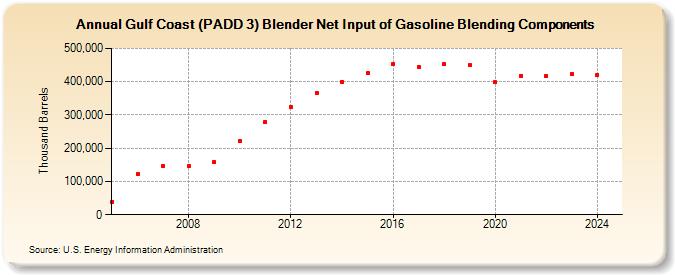
| Gulf Coast (PADD 3) Blender Net Input of Gasoline Blending Components (Thousand Barrels) | ||||||||
| Decade | Year-0 | Year-1 | Year-2 | Year-3 | Year-4 | Year-5 | Year-6 | Year-7 | Year-8 | Year-9 |
|---|---|---|---|---|---|---|---|---|---|---|
| 2000's | 39,392 | 122,787 | 145,596 | 145,667 | 158,815 | |||||
| 2010's | 222,410 | 278,249 | 324,418 | 366,025 | 399,713 | 424,808 | 453,250 | 445,168 | 451,927 | 450,292 |
| 2020's | 397,579 | 417,531 | 417,648 | 423,193 |
| - = No Data Reported; -- = Not Applicable; NA = Not Available; W = Withheld to avoid disclosure of individual company data. |
| Release Date: 3/29/2024 |
| Next Release Date: 8/30/2024 |