|
Download Data (XLS File) |
|
||||||||
|
||||||||
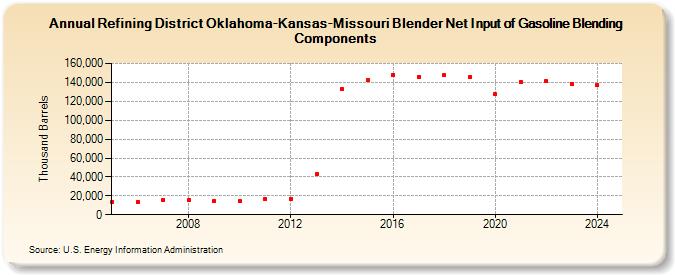
| Refining District Oklahoma-Kansas-Missouri Blender Net Input of Gasoline Blending Components (Thousand Barrels) | ||||||||
| Decade | Year-0 | Year-1 | Year-2 | Year-3 | Year-4 | Year-5 | Year-6 | Year-7 | Year-8 | Year-9 |
|---|---|---|---|---|---|---|---|---|---|---|
| 2000's | 13,645 | 13,863 | 15,737 | 15,389 | 14,750 | |||||
| 2010's | 14,335 | 16,245 | 16,794 | 42,582 | 133,111 | 142,054 | 147,636 | 146,065 | 147,365 | 145,468 |
| 2020's | 127,383 | 140,557 | 141,114 | 138,336 |
| - = No Data Reported; -- = Not Applicable; NA = Not Available; W = Withheld to avoid disclosure of individual company data. |
| Release Date: 6/28/2024 |
| Next Release Date: 8/30/2024 |