|
Download Data (XLS File) |
|
||||||||
|
||||||||
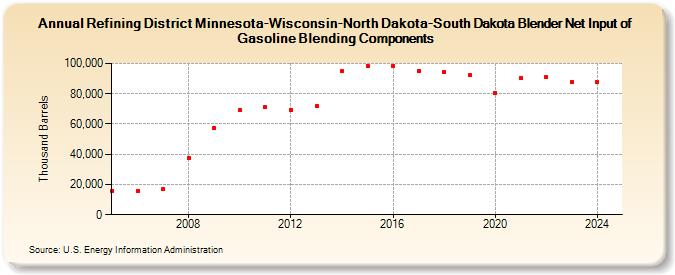
| Refining District Minnesota-Wisconsin-North Dakota-South Dakota Blender Net Input of Gasoline Blending Components (Thousand Barrels) | ||||||||
| Decade | Year-0 | Year-1 | Year-2 | Year-3 | Year-4 | Year-5 | Year-6 | Year-7 | Year-8 | Year-9 |
|---|---|---|---|---|---|---|---|---|---|---|
| 2000's | 15,702 | 15,766 | 17,171 | 37,667 | 57,341 | |||||
| 2010's | 69,223 | 70,958 | 69,367 | 71,719 | 94,734 | 98,607 | 98,635 | 95,317 | 94,658 | 92,529 |
| 2020's | 80,722 | 90,450 | 90,858 | 88,035 |
| - = No Data Reported; -- = Not Applicable; NA = Not Available; W = Withheld to avoid disclosure of individual company data. |
| Release Date: 3/29/2024 |
| Next Release Date: 8/30/2024 |