|
Download Data (XLS File) |
|
||||||||
|
||||||||
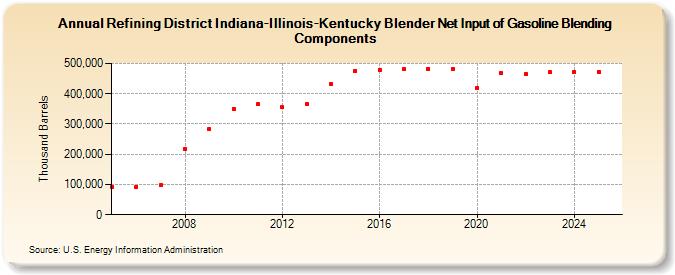
| Refining District Indiana-Illinois-Kentucky Blender Net Input of Gasoline Blending Components (Thousand Barrels) | ||||||||
| Decade | Year-0 | Year-1 | Year-2 | Year-3 | Year-4 | Year-5 | Year-6 | Year-7 | Year-8 | Year-9 |
|---|---|---|---|---|---|---|---|---|---|---|
| 2000's | 92,072 | 92,957 | 97,713 | 218,546 | 282,327 | |||||
| 2010's | 350,229 | 365,003 | 355,156 | 365,831 | 431,655 | 476,338 | 479,999 | 480,563 | 483,243 | 481,929 |
| 2020's | 419,796 | 466,996 | 465,583 | 470,535 |
| - = No Data Reported; -- = Not Applicable; NA = Not Available; W = Withheld to avoid disclosure of individual company data. |
| Release Date: 3/29/2024 |
| Next Release Date: 8/30/2024 |