|
Download Data (XLS File) |
|
||||||||
|
||||||||
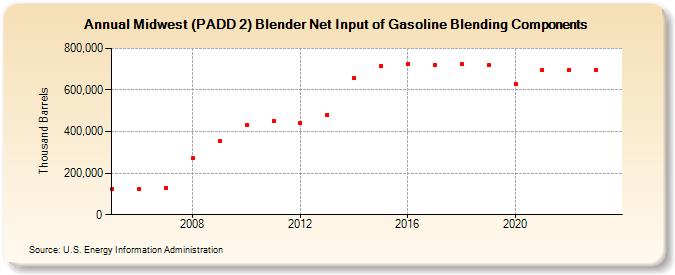
| Midwest (PADD 2) Blender Net Input of Gasoline Blending Components (Thousand Barrels) | ||||||||
| Decade | Year-0 | Year-1 | Year-2 | Year-3 | Year-4 | Year-5 | Year-6 | Year-7 | Year-8 | Year-9 |
|---|---|---|---|---|---|---|---|---|---|---|
| 2000's | 121,419 | 122,586 | 130,621 | 271,602 | 354,418 | |||||
| 2010's | 433,787 | 452,206 | 441,317 | 480,132 | 659,500 | 716,999 | 726,270 | 721,945 | 725,266 | 719,926 |
| 2020's | 627,901 | 698,003 | 697,555 | 696,906 |
| - = No Data Reported; -- = Not Applicable; NA = Not Available; W = Withheld to avoid disclosure of individual company data. |
| Release Date: 3/29/2024 |
| Next Release Date: 8/30/2024 |