|
Download Data (XLS File) |
|
||||||||
|
||||||||
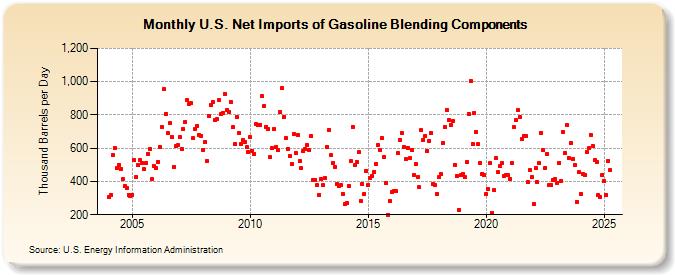
| U.S. Net Imports of Gasoline Blending Components (Thousand Barrels per Day) | ||||||||
| Year | Jan | Feb | Mar | Apr | May | Jun | Jul | Aug | Sep | Oct | Nov | Dec |
|---|---|---|---|---|---|---|---|---|---|---|---|---|
| 2004 | 305 | 321 | 558 | 602 | 478 | 500 | 475 | 413 | 371 | 360 | 320 | 310 |
| 2005 | 321 | 526 | 424 | 497 | 527 | 513 | 472 | 513 | 567 | 598 | 412 | 492 |
| 2006 | 482 | 519 | 605 | 728 | 955 | 808 | 690 | 751 | 669 | 489 | 613 | 617 |
| 2007 | 666 | 594 | 714 | 756 | 888 | 868 | 871 | 659 | 717 | 736 | 678 | 675 |
| 2008 | 592 | 638 | 524 | 791 | 862 | 879 | 768 | 773 | 887 | 805 | 814 | 926 |
| 2009 | 832 | 820 | 880 | 725 | 623 | 788 | 694 | 626 | 648 | 638 | 605 | 578 |
| 2010 | 666 | 585 | 566 | 743 | 742 | 741 | 911 | 854 | 730 | 716 | 545 | 601 |
| 2011 | 716 | 609 | 587 | 816 | 963 | 790 | 661 | 598 | 551 | 505 | 685 | 570 |
| 2012 | 679 | 523 | 478 | 581 | 594 | 619 | 588 | 673 | 406 | 410 | 377 | 320 |
| 2013 | 413 | 376 | 423 | 607 | 710 | 557 | 511 | 489 | 384 | 373 | 379 | 326 |
| 2014 | 262 | 272 | 375 | 521 | 729 | 496 | 518 | 575 | 284 | 385 | 325 | 465 |
| 2015 | 380 | 421 | 433 | 457 | 505 | 617 | 589 | 661 | 548 | 392 | 201 | 282 |
| 2016 | 336 | 342 | 343 | 571 | 650 | 690 | 607 | 536 | 604 | 539 | 589 | 439 |
| 2017 | 504 | 428 | 365 | 707 | 650 | 674 | 584 | 646 | 690 | 386 | 376 | 325 |
| 2018 | 426 | 443 | 633 | 726 | 830 | 771 | 742 | 766 | 500 | 435 | 228 | 436 |
| 2019 | 445 | 425 | 514 | 808 | 1,004 | 626 | 813 | 697 | 623 | 513 | 447 | 438 |
| 2020 | 326 | 354 | 508 | 212 | 348 | 539 | 454 | 491 | 512 | 430 | 438 | 438 |
| 2021 | 416 | 509 | 725 | 770 | 827 | 786 | 653 | 673 | 673 | 395 | 467 | 424 |
| 2022 | 267 | 479 | 395 | 510 | 693 | 588 | 483 | 566 | 376 | 376 | 406 | 413 |
| 2023 | 393 | 513 | 404 | 699 | 572 | 739 | 540 | 630 | 533 | 498 | 278 | 454 |
| 2024 | 325 | 447 | 440 | 578 | 599 | 682 | ||||||
| - = No Data Reported; -- = Not Applicable; NA = Not Available; W = Withheld to avoid disclosure of individual company data. |
| Release Date: 8/30/2024 |
| Next Release Date: 9/30/2024 |