|
Download Data (XLS File) |
|
||||||||
|
||||||||
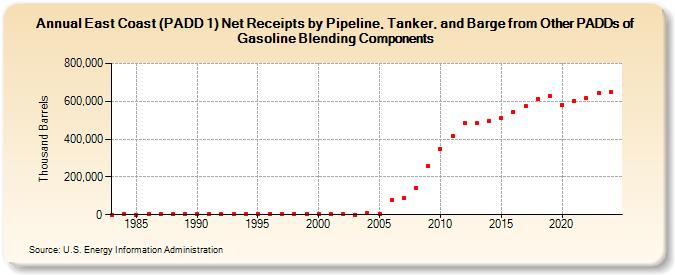
| East Coast (PADD 1) Net Receipts by Pipeline, Tanker, and Barge from Other PADDs of Gasoline Blending Components (Thousand Barrels) | ||||||||
| Decade | Year-0 | Year-1 | Year-2 | Year-3 | Year-4 | Year-5 | Year-6 | Year-7 | Year-8 | Year-9 |
|---|---|---|---|---|---|---|---|---|---|---|
| 1980's | 541 | 1,290 | 1,124 | 3,675 | 2,983 | 1,550 | 3,049 | |||
| 1990's | 2,888 | 4,210 | 2,123 | 1,652 | 2,568 | 3,051 | 6,106 | 5,445 | 6,129 | 4,051 |
| 2000's | 1,909 | 2,060 | 1,278 | 556 | 6,943 | 6,224 | 78,253 | 87,234 | 142,254 | 257,568 |
| 2010's | 344,995 | 416,132 | 483,235 | 483,520 | 497,960 | 510,551 | 545,955 | 573,371 | 614,213 | 629,963 |
| 2020's | 582,582 | 600,232 | 616,628 | 644,395 |
| - = No Data Reported; -- = Not Applicable; NA = Not Available; W = Withheld to avoid disclosure of individual company data. |
| Release Date: 3/29/2024 |
| Next Release Date: 8/30/2024 |