|
Download Data (XLS File) |
|
||||||||
|
||||||||
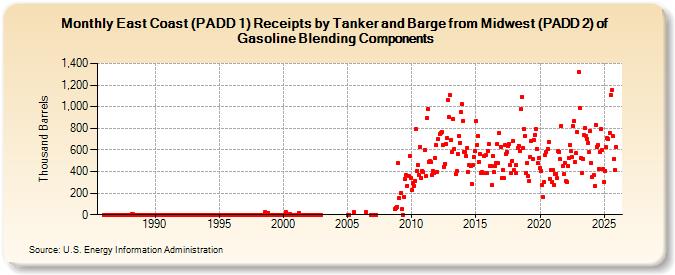
| East Coast (PADD 1) Receipts by Tanker and Barge from Midwest (PADD 2) of Gasoline Blending Components (Thousand Barrels) | ||||||||
| Year | Jan | Feb | Mar | Apr | May | Jun | Jul | Aug | Sep | Oct | Nov | Dec |
|---|---|---|---|---|---|---|---|---|---|---|---|---|
| 1986 | 0 | 0 | 0 | 0 | 0 | 0 | 0 | 0 | 0 | 0 | 0 | 0 |
| 1987 | 0 | 0 | 0 | 0 | 0 | 0 | 0 | 0 | 0 | 0 | 0 | 0 |
| 1988 | 0 | 0 | 10 | 10 | 0 | 0 | 0 | 0 | 0 | 0 | 0 | 0 |
| 1989 | 0 | 0 | 0 | 0 | 0 | 0 | 0 | 0 | 0 | 0 | 0 | 0 |
| 1990 | 0 | 0 | 0 | 0 | 0 | 0 | 0 | 0 | 0 | 0 | 0 | 0 |
| 1991 | 0 | 0 | 0 | 0 | 0 | 0 | 0 | 0 | 0 | 0 | 0 | 0 |
| 1992 | 0 | 0 | 0 | 0 | 0 | 0 | 0 | 0 | 0 | 0 | 0 | 0 |
| 1993 | 0 | 0 | 0 | 0 | 0 | 0 | 0 | 0 | 0 | 0 | 0 | 0 |
| 1994 | 0 | 0 | 0 | 0 | 0 | 0 | 0 | 0 | 0 | 0 | 0 | 0 |
| 1995 | 0 | 0 | 0 | 0 | 0 | 0 | 0 | 0 | 0 | 0 | 0 | 0 |
| 1996 | 0 | 0 | 0 | 0 | 0 | 0 | 0 | 0 | 0 | 0 | 0 | 0 |
| 1997 | 0 | 0 | 0 | 0 | 0 | 0 | 0 | 0 | 0 | 0 | 0 | 0 |
| 1998 | 0 | 0 | 0 | 0 | 0 | 0 | 0 | 25 | 0 | 0 | 19 | 0 |
| 1999 | 0 | 0 | 0 | 0 | 0 | 0 | 0 | 0 | 0 | 0 | 0 | 0 |
| 2000 | 0 | 0 | 27 | 0 | 0 | 0 | 9 | 0 | 0 | 0 | 0 | 0 |
| 2001 | 0 | 0 | 0 | 12 | 0 | 0 | 0 | 0 | 0 | 0 | 0 | 0 |
| 2002 | 0 | 0 | 0 | 0 | 0 | 0 | 0 | 0 | 0 | 0 | 0 | 0 |
| 2005 | 0 | 0 | 24 | |||||||||
| 2006 | 26 | 0 | ||||||||||
| 2007 | 0 | 0 | 0 | 0 | ||||||||
| 2008 | 49 | 64 | 75 | 480 | ||||||||
| 2009 | 156 | 204 | 50 | 0 | 165 | 327 | 368 | 269 | 355 | 540 | 339 | |
| 2010 | 228 | 293 | 269 | 315 | 792 | 409 | 458 | 367 | 629 | 343 | 405 | 393 |
| 2011 | 601 | 356 | 896 | 978 | 492 | 493 | 486 | 371 | 405 | 383 | 523 | 643 |
| 2012 | 396 | 700 | 746 | 760 | 770 | 645 | 445 | 472 | 655 | 711 | 1,060 | 901 |
| 2013 | 1,108 | 695 | 585 | 885 | 608 | 374 | 401 | 566 | 730 | 665 | 950 | 1,024 |
| 2014 | 871 | 578 | 584 | 540 | 622 | 398 | 462 | 448 | 288 | 457 | 538 | 587 |
| 2015 | 865 | 649 | 730 | 491 | 563 | 388 | 395 | 386 | 542 | 549 | 382 | 590 |
| 2016 | 654 | 450 | 448 | 277 | 547 | 392 | 453 | 479 | 655 | 478 | 757 | 631 |
| 2017 | 336 | 416 | 336 | 645 | 558 | 583 | 638 | 658 | 457 | 389 | 498 | 679 |
| 2018 | 412 | 388 | 459 | 618 | 640 | 588 | 974 | 1,094 | 617 | 794 | 727 | 390 |
| 2019 | 481 | 356 | 309 | 533 | 683 | 513 | 696 | 742 | 795 | 612 | 477 | 525 |
| 2020 | 432 | 409 | 273 | 160 | 304 | 549 | 580 | 611 | 677 | 331 | 412 | 301 |
| 2021 | 411 | 277 | 373 | 381 | 336 | 586 | 583 | 515 | 825 | 447 | 373 | 482 |
| 2022 | 309 | 301 | 455 | 528 | 648 | 594 | 532 | 817 | 865 | 489 | 570 | 764 |
| 2023 | 1,324 | 987 | 525 | 386 | 516 | 741 | 805 | 725 | 705 | 665 | 578 | 772 |
| 2024 | 477 | |||||||||||
| - = No Data Reported; -- = Not Applicable; NA = Not Available; W = Withheld to avoid disclosure of individual company data. |
| Release Date: 3/29/2024 |
| Next Release Date: 4/30/2024 |