|
Download Data (XLS File) |
|
||||||||
|
||||||||
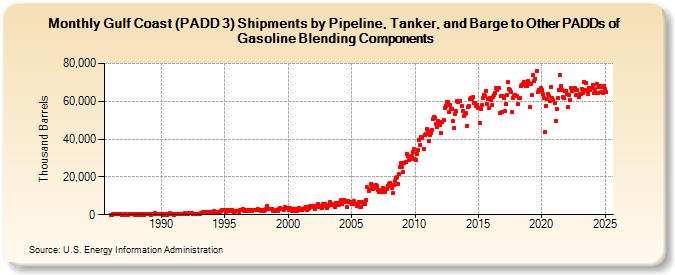
| Gulf Coast (PADD 3) Shipments by Pipeline, Tanker, and Barge to Other PADDs of Gasoline Blending Components (Thousand Barrels) | ||||||||
| Year | Jan | Feb | Mar | Apr | May | Jun | Jul | Aug | Sep | Oct | Nov | Dec |
|---|---|---|---|---|---|---|---|---|---|---|---|---|
| 1986 | 92 | 66 | 179 | 280 | 208 | 148 | 145 | 376 | 277 | 440 | 252 | 23 |
| 1987 | 25 | 23 | 230 | 33 | 107 | 222 | 531 | 203 | 240 | 213 | 176 | 54 |
| 1988 | 81 | 127 | 188 | 105 | 232 | 63 | 114 | 53 | 199 | 218 | 218 | 161 |
| 1989 | 131 | 149 | 68 | 338 | 375 | 399 | 756 | 413 | 272 | 135 | 114 | 209 |
| 1990 | 135 | 190 | 83 | 485 | 369 | 60 | 534 | 237 | 839 | 365 | 259 | 171 |
| 1991 | 99 | 281 | 348 | 544 | 221 | 524 | 382 | 164 | 514 | 601 | 743 | 262 |
| 1992 | 543 | 444 | 707 | 803 | 795 | 785 | 608 | 370 | 407 | 512 | 204 | 415 |
| 1993 | 298 | 826 | 1,057 | 1,396 | 1,220 | 735 | 1,215 | 907 | 1,538 | 1,651 | 652 | 1,255 |
| 1994 | 828 | 909 | 1,974 | 1,254 | 1,680 | 1,357 | 1,645 | 1,489 | 1,905 | 2,325 | 2,482 | 2,748 |
| 1995 | 2,735 | 1,526 | 2,364 | 2,345 | 1,848 | 1,913 | 2,469 | 2,259 | 1,904 | 1,574 | 1,944 | 2,074 |
| 1996 | 1,834 | 1,620 | 2,490 | 2,638 | 2,280 | 3,094 | 1,974 | 2,354 | 1,948 | 2,089 | 2,528 | 2,220 |
| 1997 | 2,681 | 1,769 | 1,861 | 2,344 | 2,478 | 2,636 | 2,544 | 3,094 | 2,298 | 2,599 | 2,073 | 2,427 |
| 1998 | 2,425 | 2,221 | 2,493 | 2,869 | 4,724 | 2,896 | 2,986 | 3,120 | 2,824 | 3,103 | 1,850 | 2,109 |
| 1999 | 2,303 | 2,344 | 2,204 | 2,924 | 3,303 | 3,189 | 3,130 | 3,152 | 2,726 | 3,975 | 3,629 | 3,707 |
| 2000 | 3,321 | 2,657 | 3,308 | 2,393 | 2,183 | 3,263 | 2,869 | 2,122 | 1,795 | 3,148 | 3,395 | 2,472 |
| 2001 | 2,256 | 2,342 | 3,053 | 2,781 | 3,788 | 3,991 | 2,403 | 2,782 | 3,634 | 4,783 | 4,530 | 3,819 |
| 2002 | 4,427 | 2,933 | 3,926 | 4,393 | 5,496 | 4,692 | 4,319 | 4,286 | 3,750 | 5,859 | 5,705 | 5,719 |
| 2003 | 4,544 | 3,521 | 4,466 | 5,315 | 6,669 | 5,841 | 4,881 | 5,069 | 4,257 | 6,257 | 5,347 | 6,069 |
| 2004 | 5,301 | 6,056 | 7,595 | 5,656 | 7,404 | 7,785 | 7,222 | 6,531 | 3,930 | 7,415 | 6,843 | 6,240 |
| 2005 | 5,855 | 6,739 | 7,025 | 5,490 | 5,740 | 4,713 | 5,893 | 6,491 | 3,907 | 4,048 | 6,544 | 5,575 |
| 2006 | 5,617 | 5,695 | 7,612 | 14,509 | 12,755 | 13,432 | 16,461 | 15,883 | 13,856 | 14,169 | 15,277 | 15,530 |
| 2007 | 15,231 | 12,878 | 12,046 | 12,579 | 12,115 | 12,983 | 14,315 | 12,201 | 12,169 | 13,645 | 15,282 | 16,328 |
| 2008 | 16,648 | 15,479 | 14,230 | 11,283 | 15,649 | 17,585 | 19,547 | 19,869 | 16,481 | 21,781 | 25,462 | 27,453 |
| 2009 | 25,331 | 22,779 | 27,514 | 27,972 | 32,214 | 31,218 | 29,048 | 30,718 | 29,277 | 30,971 | 33,265 | 34,569 |
| 2010 | 29,309 | 28,961 | 32,277 | 34,265 | 39,307 | 36,903 | 41,140 | 40,621 | 34,890 | 42,289 | 42,706 | 45,105 |
| 2011 | 44,380 | 38,824 | 42,117 | 43,282 | 45,045 | 50,502 | 51,945 | 51,306 | 48,143 | 46,604 | 49,377 | 47,608 |
| 2012 | 47,567 | 43,056 | 49,265 | 50,245 | 56,420 | 57,537 | 59,472 | 59,767 | 54,176 | 58,004 | 55,776 | 55,935 |
| 2013 | 49,422 | 45,818 | 53,513 | 54,685 | 59,920 | 59,448 | 60,379 | 60,280 | 57,686 | 55,012 | 52,021 | 53,106 |
| 2014 | 53,650 | 47,006 | 57,033 | 57,349 | 61,002 | 61,666 | 61,216 | 62,273 | 59,167 | 59,323 | 57,414 | 57,867 |
| 2015 | 56,704 | 48,349 | 55,736 | 57,813 | 61,696 | 63,476 | 62,846 | 65,638 | 58,434 | 61,104 | 56,244 | 61,970 |
| 2016 | 60,693 | 57,974 | 62,323 | 63,088 | 64,431 | 66,875 | 66,182 | 67,285 | 53,713 | 62,624 | 54,433 | 62,719 |
| 2017 | 61,601 | 54,792 | 58,513 | 63,189 | 70,189 | 66,625 | 66,041 | 64,756 | 54,105 | 61,638 | 62,953 | 63,450 |
| 2018 | 62,899 | 58,330 | 61,819 | 61,757 | 67,958 | 68,713 | 69,205 | 70,417 | 69,936 | 67,970 | 68,174 | 70,691 |
| 2019 | 69,798 | 56,929 | 69,338 | 63,357 | 73,980 | 70,496 | 71,955 | 76,222 | 64,691 | 65,835 | 65,320 | 67,030 |
| 2020 | 66,067 | 63,711 | 61,715 | 43,499 | 57,716 | 61,326 | 64,063 | 62,672 | 60,359 | 67,330 | 61,595 | 60,688 |
| 2021 | 59,225 | 49,591 | 56,012 | 61,806 | 65,811 | 73,874 | 68,193 | 65,865 | 62,081 | 61,642 | 65,427 | 65,642 |
| 2022 | 63,636 | 56,784 | 63,272 | 60,549 | 66,870 | 65,274 | 66,220 | 67,143 | 63,109 | 65,867 | 63,162 | 62,406 |
| 2023 | 64,080 | 63,635 | 66,578 | 64,142 | 69,967 | 65,985 | 69,833 | 65,548 | 63,922 | 68,109 | 65,929 | 66,869 |
| 2024 | 68,429 | |||||||||||
| - = No Data Reported; -- = Not Applicable; NA = Not Available; W = Withheld to avoid disclosure of individual company data. |
| Release Date: 3/29/2024 |
| Next Release Date: 4/30/2024 |
Referring Pages: