|
Download Data (XLS File) |
|
||||||||
|
||||||||
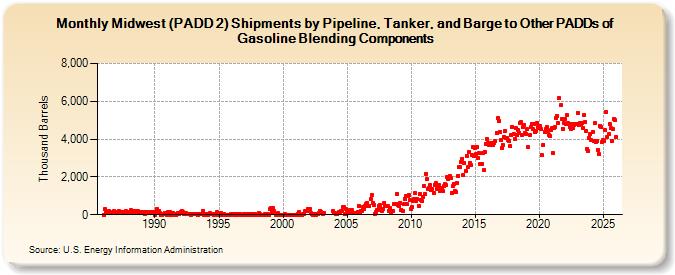
| Midwest (PADD 2) Shipments by Pipeline, Tanker, and Barge to Other PADDs of Gasoline Blending Components (Thousand Barrels) | ||||||||
| Year | Jan | Feb | Mar | Apr | May | Jun | Jul | Aug | Sep | Oct | Nov | Dec |
|---|---|---|---|---|---|---|---|---|---|---|---|---|
| 1986 | 0 | 294 | 100 | 105 | 162 | 183 | 122 | 73 | 82 | 113 | 190 | 66 |
| 1987 | 151 | 130 | 194 | 163 | 143 | 143 | 118 | 105 | 126 | 174 | 147 | 158 |
| 1988 | 89 | 144 | 223 | 156 | 185 | 90 | 176 | 106 | 177 | 93 | 128 | 139 |
| 1989 | 123 | 166 | 162 | 36 | 124 | 93 | 143 | 84 | 66 | 118 | 101 | 121 |
| 1990 | 0 | 150 | 277 | 128 | 219 | 76 | 0 | 0 | 45 | 106 | 115 | 0 |
| 1991 | 121 | 78 | 156 | 0 | 49 | 117 | 63 | 0 | 0 | 55 | 97 | 40 |
| 1992 | 148 | 194 | 119 | 57 | 33 | 66 | 26 | 17 | 36 | 29 | 5 | 27 |
| 1993 | 40 | 16 | 23 | 19 | 7 | 24 | 28 | 18 | 62 | 191 | 11 | 8 |
| 1994 | 12 | 16 | 1 | 52 | 72 | 15 | 26 | 3 | 22 | 19 | 131 | 7 |
| 1995 | 4 | 7 | 74 | 0 | 52 | 59 | 0 | 0 | 0 | 0 | 0 | 20 |
| 1996 | 20 | 25 | 0 | 0 | 57 | 0 | 15 | 16 | 22 | 0 | 0 | 13 |
| 1997 | 13 | 0 | 0 | 20 | 0 | 1 | 20 | 20 | 0 | 20 | 17 | 0 |
| 1998 | 1 | 69 | 29 | 0 | 0 | 0 | 0 | 25 | 0 | 0 | 19 | 0 |
| 1999 | 311 | 334 | 147 | 341 | 183 | 0 | 0 | 88 | 0 | 0 | 0 | 0 |
| 2000 | 0 | 0 | 27 | 0 | 0 | 0 | 9 | 0 | 0 | 6 | 0 | 0 |
| 2001 | 0 | 1 | 51 | 139 | 0 | 1 | 0 | 50 | 56 | 174 | 185 | 313 |
| 2002 | 309 | 313 | 100 | 19 | 0 | 15 | 0 | 2 | 36 | 14 | 91 | 201 |
| 2003 | 157 | 56 | 76 | 198 | ||||||||
| 2004 | 84 | 69 | 45 | 46 | 132 | 105 | 173 | 218 | 420 | 390 | 54 | 302 |
| 2005 | 187 | 106 | 154 | 231 | 136 | 239 | 71 | 87 | 67 | 92 | 163 | 465 |
| 2006 | 70 | 220 | 174 | 389 | 298 | 437 | 556 | 623 | 484 | 469 | 821 | 1,039 |
| 2007 | 621 | 535 | 56 | 159 | 235 | 261 | 451 | 505 | 292 | 218 | 300 | 636 |
| 2008 | 439 | 463 | 470 | 198 | 347 | 165 | 177 | 190 | 575 | 554 | 584 | 1,099 |
| 2009 | 532 | 473 | 625 | 271 | 211 | 549 | 855 | 1,008 | 541 | 991 | 1,058 | 755 |
| 2010 | 315 | 412 | 726 | 815 | 1,138 | 751 | 818 | 483 | 1,098 | 802 | 751 | 963 |
| 2011 | 1,528 | 1,086 | 2,170 | 1,888 | 1,358 | 1,392 | 1,557 | 1,291 | 1,371 | 1,167 | 1,588 | 1,660 |
| 2012 | 1,370 | 1,401 | 1,556 | 1,259 | 1,283 | 1,402 | 1,237 | 1,534 | 1,628 | 1,552 | 1,984 | 1,867 |
| 2013 | 2,048 | 1,955 | 1,162 | 1,501 | 1,641 | 1,263 | 1,222 | 1,699 | 2,063 | 2,518 | 2,521 | 2,775 |
| 2014 | 2,964 | 2,092 | 2,737 | 2,307 | 3,109 | 2,534 | 3,331 | 2,742 | 2,607 | 3,146 | 3,593 | 3,084 |
| 2015 | 3,529 | 3,210 | 3,574 | 3,021 | 3,258 | 2,679 | 2,671 | 3,262 | 2,348 | 3,326 | 3,767 | 4,004 |
| 2016 | 3,809 | 3,665 | 3,777 | 3,678 | 3,768 | 3,676 | 3,807 | 3,907 | 4,337 | 5,094 | 4,981 | 4,381 |
| 2017 | 3,939 | 3,519 | 3,710 | 4,126 | 4,420 | 4,043 | 4,081 | 3,963 | 3,901 | 3,630 | 4,193 | 4,651 |
| 2018 | 4,259 | 4,000 | 4,567 | 4,237 | 4,492 | 4,333 | 4,854 | 4,899 | 4,219 | 4,638 | 4,759 | 4,325 |
| 2019 | 4,273 | 4,509 | 3,558 | 4,201 | 4,631 | 4,805 | 4,520 | 4,796 | 4,374 | 4,435 | 4,843 | 4,651 |
| 2020 | 4,609 | 4,681 | 4,508 | 3,138 | 3,696 | 4,361 | 4,537 | 4,631 | 4,429 | 4,234 | 4,166 | 4,474 |
| 2021 | 4,588 | 3,259 | 4,564 | 4,633 | 5,136 | 5,234 | 4,859 | 6,163 | 5,782 | 5,075 | 4,546 | 4,853 |
| 2022 | 5,052 | 4,779 | 5,256 | 4,831 | 4,778 | 4,620 | 4,531 | 4,797 | 4,598 | 4,769 | 4,781 | 4,825 |
| 2023 | 5,405 | 4,735 | 4,851 | 4,802 | 4,837 | 4,605 | 5,259 | 4,915 | 4,426 | 3,500 | 3,373 | 4,058 |
| 2024 | 4,266 | 3,937 | 4,380 | 3,906 | ||||||||
| - = No Data Reported; -- = Not Applicable; NA = Not Available; W = Withheld to avoid disclosure of individual company data. |
| Release Date: 6/28/2024 |
| Next Release Date: 7/31/2024 |
Referring Pages: