|
Download Data (XLS File) |
|
||||||||
|
||||||||
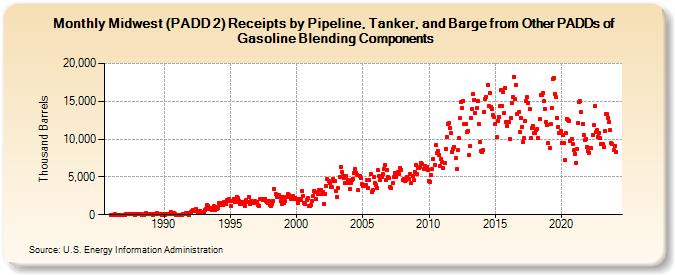
| Midwest (PADD 2) Receipts by Pipeline, Tanker, and Barge from Other PADDs of Gasoline Blending Components (Thousand Barrels) | ||||||||
| Year | Jan | Feb | Mar | Apr | May | Jun | Jul | Aug | Sep | Oct | Nov | Dec |
|---|---|---|---|---|---|---|---|---|---|---|---|---|
| 1986 | 0 | 0 | 0 | 0 | 84 | 0 | 0 | 0 | 0 | 0 | 0 | 0 |
| 1987 | 25 | 19 | 42 | 87 | 73 | 76 | 78 | 29 | 63 | 107 | 10 | 65 |
| 1988 | 72 | 50 | 45 | 106 | 19 | 10 | 10 | 30 | 249 | 47 | 93 | 58 |
| 1989 | 55 | 109 | 27 | 83 | 66 | 69 | 170 | 130 | 68 | 88 | 5 | 30 |
| 1990 | 15 | 25 | 35 | 145 | 156 | 75 | 363 | 257 | 68 | 180 | 80 | 12 |
| 1991 | 16 | 21 | 15 | 14 | 25 | 155 | 118 | 30 | 168 | 146 | 207 | 15 |
| 1992 | 333 | 459 | 643 | 490 | 558 | 738 | 449 | 240 | 199 | 526 | 218 | 261 |
| 1993 | 306 | 689 | 757 | 1,230 | 1,092 | 764 | 828 | 611 | 884 | 1,106 | 624 | 994 |
| 1994 | 810 | 900 | 1,608 | 1,221 | 1,531 | 1,344 | 1,616 | 1,356 | 1,405 | 1,952 | 1,806 | 2,068 |
| 1995 | 1,873 | 1,129 | 1,756 | 2,107 | 1,669 | 1,715 | 2,341 | 2,169 | 1,852 | 1,466 | 1,455 | 1,653 |
| 1996 | 1,454 | 1,147 | 1,919 | 1,653 | 1,648 | 2,339 | 1,442 | 1,867 | 1,726 | 1,593 | 1,758 | 1,538 |
| 1997 | 1,747 | 1,220 | 1,216 | 2,021 | 2,031 | 2,075 | 1,909 | 2,034 | 1,859 | 1,651 | 1,615 | 1,861 |
| 1998 | 1,310 | 1,211 | 1,436 | 1,850 | 3,402 | 2,705 | 2,382 | 2,503 | 2,588 | 2,387 | 1,837 | 1,455 |
| 1999 | 2,281 | 1,485 | 1,767 | 2,346 | 2,709 | 2,553 | 2,398 | 2,130 | 2,174 | 2,505 | 2,132 | 2,257 |
| 2000 | 2,109 | 1,605 | 2,107 | 2,013 | 1,892 | 3,078 | 2,447 | 1,538 | 1,462 | 2,009 | 2,235 | 1,107 |
| 2001 | 1,126 | 1,265 | 1,869 | 2,507 | 3,138 | 3,036 | 2,115 | 2,716 | 3,216 | 3,306 | 3,268 | 2,692 |
| 2002 | 3,033 | 1,424 | 2,791 | 3,817 | 4,688 | 4,460 | 4,156 | 3,708 | 3,614 | 4,664 | 4,438 | 4,480 |
| 2003 | 3,195 | 2,327 | 3,501 | 4,960 | 6,299 | 5,606 | 5,097 | 4,915 | 4,159 | 5,079 | 4,177 | 4,528 |
| 2004 | 3,445 | 4,203 | 4,634 | 4,760 | 5,540 | 6,067 | 5,563 | 5,286 | 3,209 | 5,130 | 4,912 | 4,060 |
| 2005 | 3,836 | 3,818 | 3,878 | 3,964 | 4,594 | 3,584 | 4,601 | 5,353 | 3,027 | 3,318 | 5,014 | 4,207 |
| 2006 | 3,920 | 3,587 | 5,871 | 5,185 | 4,538 | 4,990 | 5,338 | 6,010 | 6,560 | 4,547 | 5,971 | 4,988 |
| 2007 | 4,880 | 3,694 | 3,490 | 4,190 | 4,985 | 5,574 | 5,028 | 5,367 | 5,700 | 5,370 | 6,191 | 5,975 |
| 2008 | 4,645 | 4,751 | 4,467 | 4,539 | 5,024 | 4,780 | 4,698 | 5,383 | 4,163 | 5,075 | 4,596 | 5,669 |
| 2009 | 6,631 | 5,395 | 6,193 | 6,243 | 6,356 | 6,819 | 6,651 | 6,007 | 6,437 | 6,152 | 6,376 | 5,922 |
| 2010 | 4,524 | 4,371 | 5,212 | 6,008 | 7,410 | 6,539 | 9,186 | 8,135 | 8,382 | 7,857 | 6,421 | 7,334 |
| 2011 | 7,027 | 6,128 | 6,813 | 8,734 | 10,321 | 11,998 | 12,079 | 11,484 | 10,749 | 8,269 | 8,694 | 8,988 |
| 2012 | 7,475 | 6,043 | 8,524 | 10,091 | 12,732 | 14,959 | 14,112 | 15,019 | 11,952 | 11,954 | 10,906 | 11,132 |
| 2013 | 7,888 | 9,111 | 12,787 | 14,034 | 15,950 | 15,172 | 13,477 | 14,130 | 15,062 | 11,954 | 9,561 | 8,473 |
| 2014 | 8,261 | 8,535 | 13,620 | 15,251 | 15,629 | 17,192 | 14,312 | 16,085 | 14,305 | 14,046 | 13,150 | 12,889 |
| 2015 | 11,982 | 10,235 | 12,397 | 12,927 | 14,375 | 16,470 | 14,378 | 16,213 | 13,413 | 16,807 | 12,318 | 11,700 |
| 2016 | 12,211 | 10,016 | 12,855 | 14,784 | 15,599 | 18,272 | 15,279 | 17,166 | 13,325 | 13,558 | 10,956 | 12,814 |
| 2017 | 11,652 | 9,609 | 10,084 | 12,391 | 14,980 | 15,513 | 14,811 | 13,962 | 10,118 | 11,447 | 11,693 | 10,811 |
| 2018 | 10,788 | 11,158 | 11,328 | 10,158 | 12,621 | 15,850 | 15,840 | 16,151 | 15,034 | 14,028 | 12,229 | 11,888 |
| 2019 | 9,465 | 8,829 | 11,932 | 14,140 | 18,004 | 18,131 | 16,003 | 15,550 | 12,810 | 11,604 | 10,829 | 11,024 |
| 2020 | 9,514 | 10,502 | 9,465 | 7,244 | 10,754 | 12,671 | 12,513 | 12,448 | 9,751 | 10,003 | 9,306 | 8,538 |
| 2021 | 8,078 | 6,894 | 8,662 | 12,160 | 14,866 | 14,993 | 13,553 | 11,976 | 10,510 | 9,863 | 10,075 | 8,990 |
| 2022 | 8,383 | 8,196 | 8,804 | 8,762 | 10,510 | 11,811 | 14,311 | 10,900 | 11,141 | 10,226 | 10,777 | 10,094 |
| 2023 | 9,376 | 9,384 | 8,963 | 11,125 | 13,350 | 13,254 | 12,834 | 12,233 | 11,166 | 9,440 | 9,347 | 8,498 |
| 2024 | 9,088 | |||||||||||
| - = No Data Reported; -- = Not Applicable; NA = Not Available; W = Withheld to avoid disclosure of individual company data. |
| Release Date: 3/29/2024 |
| Next Release Date: 4/30/2024 |
Referring Pages: