|
Download Data (XLS File) |
|
||||||||
|
||||||||
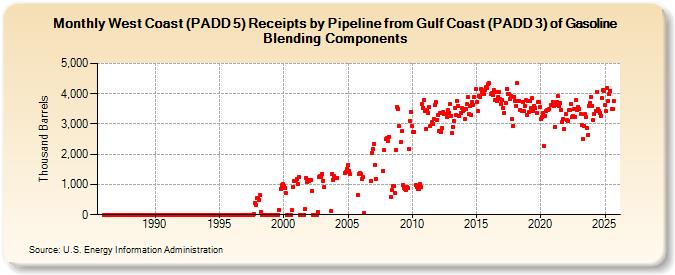
| West Coast (PADD 5) Receipts by Pipeline from Gulf Coast (PADD 3) of Gasoline Blending Components (Thousand Barrels) | ||||||||
| Year | Jan | Feb | Mar | Apr | May | Jun | Jul | Aug | Sep | Oct | Nov | Dec |
|---|---|---|---|---|---|---|---|---|---|---|---|---|
| 1986 | 0 | 0 | 0 | 0 | 0 | 0 | 0 | 0 | 0 | 0 | 0 | 0 |
| 1987 | 0 | 0 | 0 | 0 | 0 | 0 | 0 | 0 | 0 | 0 | 0 | 0 |
| 1988 | 0 | 0 | 0 | 0 | 0 | 0 | 0 | 0 | 0 | 0 | 0 | 0 |
| 1989 | 0 | 0 | 0 | 0 | 0 | 0 | 0 | 0 | 0 | 0 | 0 | 0 |
| 1990 | 0 | 0 | 0 | 0 | 0 | 0 | 0 | 0 | 0 | 0 | 0 | 0 |
| 1991 | 0 | 0 | 0 | 0 | 0 | 0 | 0 | 0 | 0 | 0 | 0 | 0 |
| 1992 | 0 | 0 | 0 | 0 | 0 | 0 | 0 | 0 | 0 | 0 | 0 | 0 |
| 1993 | 0 | 0 | 0 | 0 | 0 | 0 | 0 | 0 | 0 | 0 | 0 | 0 |
| 1994 | 0 | 0 | 0 | 0 | 0 | 0 | 0 | 0 | 0 | 0 | 0 | 0 |
| 1995 | 0 | 0 | 0 | 0 | 0 | 0 | 0 | 0 | 0 | 0 | 0 | 0 |
| 1996 | 0 | 0 | 0 | 0 | 0 | 0 | 0 | 0 | 0 | 0 | 0 | 0 |
| 1997 | 0 | 0 | 0 | 0 | 0 | 0 | 0 | 0 | 19 | 398 | 333 | 545 |
| 1998 | 557 | 501 | 646 | 100 | 0 | 0 | 0 | 0 | 0 | 0 | 0 | 0 |
| 1999 | 0 | 0 | 0 | 0 | 0 | 0 | 0 | 0 | 165 | 850 | 966 | 1,011 |
| 2000 | 953 | 894 | 717 | 0 | 0 | 0 | 0 | 0 | 140 | 910 | 1,103 | 1,119 |
| 2001 | 1,171 | 1,001 | 1,231 | 0 | 0 | 0 | 0 | 0 | 188 | 1,217 | 1,095 | 1,148 |
| 2002 | 1,124 | 1,134 | 797 | 0 | 0 | 0 | 0 | 0 | 103 | 1,249 | 1,288 | 1,260 |
| 2003 | 1,349 | 1,130 | 915 | 121 | 1,349 | 1,158 | 1,273 | |||||
| 2004 | 1,227 | 1,230 | 1,215 | 1,382 | 1,423 | 1,510 | ||||||
| 2005 | 1,632 | 1,460 | 1,330 | 654 | 1,341 | 1,368 | ||||||
| 2006 | 1,344 | 1,195 | 1,237 | 58 | 1,105 | 2,035 | 2,167 | |||||
| 2007 | 2,353 | 1,642 | 1,195 | 1,457 | 2,139 | 2,494 | ||||||
| 2008 | 2,535 | 2,423 | 2,582 | 571 | 833 | 951 | 937 | 707 | 2,150 | 3,545 | 3,484 | |
| 2009 | 2,928 | 2,393 | 2,758 | 969 | 867 | 848 | 814 | 928 | 874 | 2,164 | 3,109 | 3,393 |
| 2010 | 2,929 | 2,731 | 2,744 | 972 | 905 | 843 | 854 | 1,005 | 923 | 3,675 | 3,540 | 3,797 |
| 2011 | 3,431 | 2,819 | 3,461 | 3,361 | 3,555 | 2,922 | 3,056 | 3,001 | 3,171 | 3,631 | 3,726 | 3,145 |
| 2012 | 3,284 | 2,779 | 3,361 | 2,720 | 2,880 | 3,398 | 3,336 | 3,320 | 3,222 | 3,451 | 3,369 | 3,649 |
| 2013 | 3,273 | 2,696 | 2,902 | 3,109 | 3,543 | 3,300 | 3,755 | 3,606 | 3,271 | 3,376 | 3,533 | 3,427 |
| 2014 | 3,458 | 3,151 | 3,479 | 3,654 | 3,889 | 3,328 | 3,587 | 3,292 | 3,721 | 3,618 | 3,899 | 4,144 |
| 2015 | 3,717 | 3,436 | 3,934 | 3,885 | 4,151 | 4,061 | 3,996 | 3,980 | 4,121 | 4,221 | 4,179 | 4,314 |
| 2016 | 4,343 | 3,994 | 4,013 | 3,958 | 4,132 | 3,791 | 4,058 | 3,752 | 3,903 | 4,062 | 3,811 | 3,664 |
| 2017 | 3,788 | 3,515 | 3,377 | 3,699 | 4,168 | 3,981 | 4,007 | 3,824 | 3,924 | 3,156 | 2,940 | 3,901 |
| 2018 | 3,754 | 3,604 | 4,347 | 3,775 | 3,776 | 3,476 | 3,418 | 3,731 | 3,414 | 3,605 | 3,781 | 3,282 |
| 2019 | 3,768 | 3,401 | 3,771 | 3,520 | 3,850 | 3,433 | 3,600 | 3,540 | 3,357 | 3,721 | 3,718 | 3,558 |
| 2020 | 3,161 | 3,220 | 3,371 | 2,284 | 3,267 | 3,419 | 3,450 | 3,457 | 3,494 | 3,630 | 3,611 | 3,738 |
| 2021 | 3,587 | 2,911 | 3,643 | 3,739 | 3,917 | 3,580 | 3,683 | 3,463 | 3,073 | 3,172 | 2,846 | 3,325 |
| 2022 | 3,131 | 3,112 | 3,451 | 3,449 | 3,674 | 3,215 | 3,261 | 3,507 | 3,243 | 3,791 | 3,449 | 3,571 |
| 2023 | 3,505 | 3,344 | 2,981 | 2,492 | 2,928 | 3,329 | 3,235 | 2,875 | 2,644 | 4,580 | 3,706 | 3,906 |
| 2024 | 3,607 | |||||||||||
| - = No Data Reported; -- = Not Applicable; NA = Not Available; W = Withheld to avoid disclosure of individual company data. |
| Release Date: 3/29/2024 |
| Next Release Date: 4/30/2024 |