|
Download Data (XLS File) |
|
||||||||
|
||||||||
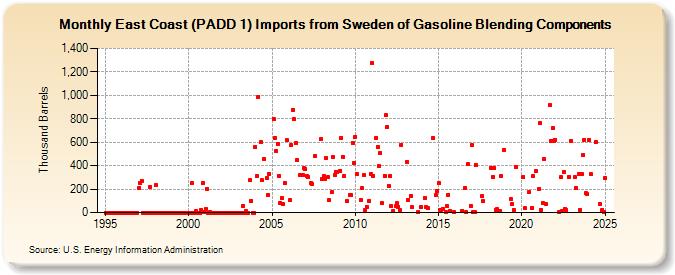
| East Coast (PADD 1) Imports from Sweden of Gasoline Blending Components (Thousand Barrels) | ||||||||
| Year | Jan | Feb | Mar | Apr | May | Jun | Jul | Aug | Sep | Oct | Nov | Dec |
|---|---|---|---|---|---|---|---|---|---|---|---|---|
| 1995 | 0 | 0 | 0 | 0 | 0 | 0 | 0 | 0 | 0 | 0 | 0 | 0 |
| 1996 | 0 | 0 | 0 | 0 | 0 | 0 | 0 | 0 | 0 | 0 | 0 | 0 |
| 1997 | 210 | 248 | 272 | 0 | 0 | 0 | 0 | 0 | 219 | 0 | 0 | 0 |
| 1998 | 233 | 0 | 0 | 0 | 0 | 0 | 0 | 0 | 0 | 0 | 0 | 0 |
| 1999 | 0 | 0 | 0 | 0 | 0 | 0 | 0 | 0 | 0 | 0 | 0 | 0 |
| 2000 | 0 | 0 | 250 | 0 | 0 | 11 | 0 | 0 | 0 | 21 | 250 | 6 |
| 2001 | 30 | 204 | 0 | 4 | 0 | 0 | 0 | 0 | 0 | 0 | 0 | 0 |
| 2002 | 0 | 0 | 0 | 0 | 0 | 0 | 0 | 0 | 0 | 0 | 0 | 0 |
| 2003 | 0 | 0 | 0 | 56 | 0 | 11 | 0 | 0 | 274 | 102 | 0 | 0 |
| 2004 | 558 | 313 | 989 | 600 | 275 | 454 | 294 | 150 | 329 | |||
| 2005 | 800 | 639 | 527 | 585 | 315 | 82 | 124 | 70 | 252 | 615 | ||
| 2006 | 103 | 575 | 877 | 795 | 589 | 449 | 320 | 319 | 378 | |||
| 2007 | 370 | 316 | 307 | 250 | 242 | 479 | 627 | |||||
| 2008 | 288 | 311 | 285 | 467 | 300 | 107 | 172 | 474 | 322 | 346 | 350 | |
| 2009 | 358 | 638 | 474 | 308 | 98 | 150 | 150 | 596 | 423 | |||
| 2010 | 647 | 326 | 106 | 207 | 318 | 19 | 50 | 102 | 329 | |||
| 2011 | 1,274 | 316 | 638 | 562 | 395 | 511 | 79 | 314 | 828 | 733 | ||
| 2012 | 228 | 314 | 54 | 11 | 52 | 79 | 50 | 20 | 580 | |||
| 2013 | 432 | 110 | 142 | 44 | 2 | 49 | ||||||
| 2014 | 128 | 48 | 35 | 638 | 146 | 184 | ||||||
| 2015 | 250 | 21 | 20 | 34 | 3 | 58 | 154 | 14 | 2 | |||
| 2016 | 17 | 212 | 4 | 410 | 60 | |||||||
| 2017 | 574 | 3 | 8 | 405 | 140 | 95 | ||||||
| 2018 | 380 | 307 | 381 | 25 | 28 | 11 | 15 | 316 | 536 | |||
| 2019 | 113 | 75 | 24 | 391 | ||||||||
| 2020 | 299 | 39 | 172 | 42 | 311 | 352 | ||||||
| 2021 | 203 | 762 | 25 | 79 | 456 | 72 | 917 | 613 | 723 | 614 | ||
| 2022 | 621 | 3 | 300 | 14 | 348 | 31 | 22 | 307 | 612 | |||
| 2023 | 300 | 210 | 330 | 20 | 329 | 491 | 621 | 164 | 160 | |||
| 2024 | 618 | |||||||||||
| - = No Data Reported; -- = Not Applicable; NA = Not Available; W = Withheld to avoid disclosure of individual company data. |
| Release Date: 3/29/2024 |
| Next Release Date: 4/30/2024 |