|
Download Data (XLS File) |
|
||||||||
|
||||||||
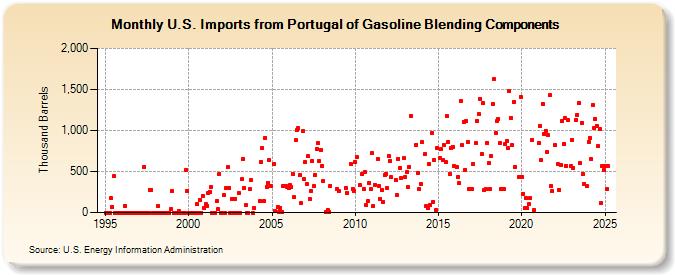
| U.S. Imports from Portugal of Gasoline Blending Components (Thousand Barrels) | ||||||||
| Year | Jan | Feb | Mar | Apr | May | Jun | Jul | Aug | Sep | Oct | Nov | Dec |
|---|---|---|---|---|---|---|---|---|---|---|---|---|
| 1995 | 0 | 0 | 0 | 0 | 173 | 73 | 440 | 0 | 0 | 0 | 0 | 0 |
| 1996 | 0 | 0 | 82 | 0 | 0 | 0 | 0 | 0 | 0 | 0 | 0 | 0 |
| 1997 | 0 | 0 | 0 | 0 | 559 | 0 | 0 | 0 | 278 | 278 | 0 | 0 |
| 1998 | 0 | 0 | 85 | 0 | 0 | 0 | 0 | 0 | 0 | 0 | 0 | 40 |
| 1999 | 257 | 0 | 0 | 0 | 0 | 14 | 0 | 0 | 0 | 0 | 516 | 263 |
| 2000 | 0 | 0 | 0 | 0 | 0 | 0 | 100 | 0 | 150 | 0 | 205 | 57 |
| 2001 | 100 | 84 | 244 | 254 | 306 | 0 | 0 | 0 | 135 | 39 | 468 | 0 |
| 2002 | 0 | 212 | 0 | 297 | 550 | 299 | 0 | 166 | 0 | 170 | 0 | 0 |
| 2003 | 239 | 0 | 404 | 656 | 298 | 87 | 0 | 0 | 281 | 391 | 0 | 60 |
| 2004 | 139 | 615 | 789 | 137 | 913 | 313 | 365 | 639 | 318 | |||
| 2005 | 588 | 19 | 65 | 8 | 56 | 5 | 324 | 325 | 315 | |||
| 2006 | 295 | 332 | 313 | 464 | 186 | 878 | 1,000 | 1,025 | 457 | 111 | 988 | 405 |
| 2007 | 613 | 352 | 685 | 163 | 266 | 629 | 319 | 459 | 772 | 846 | 626 | 767 |
| 2008 | 571 | 382 | 4 | 34 | 5 | 329 | 286 | |||||
| 2009 | 263 | 303 | 244 | 590 | 293 | 261 | ||||||
| 2010 | 621 | 677 | 335 | 468 | 290 | 499 | 92 | 138 | 358 | 286 | ||
| 2011 | 720 | 85 | 340 | 651 | 326 | 170 | 277 | 134 | 457 | 475 | 294 | |
| 2012 | 692 | 629 | 429 | 395 | 219 | 656 | 544 | 419 | 659 | |||
| 2013 | 437 | 499 | 308 | 561 | 1,180 | 829 | 488 | 288 | 349 | |||
| 2014 | 858 | 711 | 79 | 57 | 591 | 92 | 972 | 134 | 642 | 31 | 790 | |
| 2015 | 663 | 770 | 640 | 822 | 622 | 1,173 | 864 | 474 | 781 | 802 | 566 | |
| 2016 | 552 | 438 | 357 | 1,354 | 821 | 1,107 | 524 | 1,118 | 857 | 285 | ||
| 2017 | 288 | 593 | 842 | 1,116 | 1,199 | 1,389 | 718 | 1,329 | 280 | 281 | 851 | |
| 2018 | 599 | 284 | 686 | 1,320 | 1,624 | 969 | 1,115 | 1,142 | 848 | 283 | 284 | |
| 2019 | 840 | 874 | 785 | 1,479 | 1,158 | 817 | 1,349 | 558 | 437 | 1,411 | ||
| 2020 | 437 | 232 | 54 | 175 | 52 | 100 | 173 | 882 | 29 | |||
| 2021 | 850 | 1,054 | 637 | 1,327 | 961 | 998 | 738 | 940 | 1,432 | 325 | 263 | |
| 2022 | 826 | 588 | 276 | 579 | 1,115 | 838 | 1,146 | 569 | 1,128 | 568 | ||
| 2023 | 890 | 542 | 1,132 | 1,189 | 1,333 | 602 | 1,095 | 473 | 349 | 318 | ||
| 2024 | 861 | |||||||||||
| - = No Data Reported; -- = Not Applicable; NA = Not Available; W = Withheld to avoid disclosure of individual company data. |
| Release Date: 3/29/2024 |
| Next Release Date: 4/30/2024 |