|
Download Data (XLS File) |
|
||||||||
|
||||||||
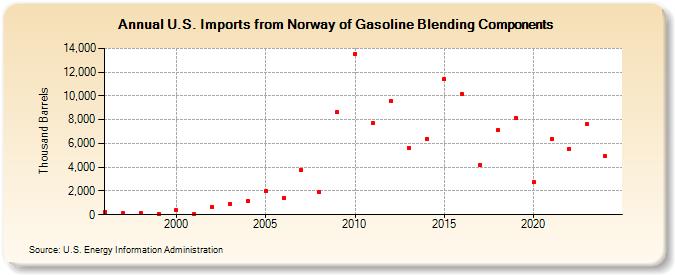
| U.S. Imports from Norway of Gasoline Blending Components (Thousand Barrels) | ||||||||
| Decade | Year-0 | Year-1 | Year-2 | Year-3 | Year-4 | Year-5 | Year-6 | Year-7 | Year-8 | Year-9 |
|---|---|---|---|---|---|---|---|---|---|---|
| 1990's | 256 | 120 | 156 | 64 | ||||||
| 2000's | 357 | 20 | 668 | 906 | 1,165 | 1,986 | 1,431 | 3,754 | 1,914 | 8,619 |
| 2010's | 13,566 | 7,743 | 9,553 | 5,619 | 6,396 | 11,411 | 10,172 | 4,225 | 7,110 | 8,114 |
| 2020's | 2,717 | 6,377 | 5,549 | 7,601 |
| - = No Data Reported; -- = Not Applicable; NA = Not Available; W = Withheld to avoid disclosure of individual company data. |
| Release Date: 8/30/2024 |
| Next Release Date: 8/29/2025 |