|
Download Data (XLS File) |
|
||||||||
|
||||||||
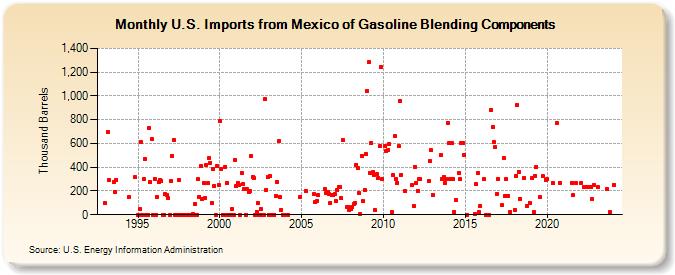
| U.S. Imports from Mexico of Gasoline Blending Components (Thousand Barrels) | ||||||||
| Year | Jan | Feb | Mar | Apr | May | Jun | Jul | Aug | Sep | Oct | Nov | Dec |
|---|---|---|---|---|---|---|---|---|---|---|---|---|
| 1993 | 95 | 693 | 291 | 274 | 194 | 296 | ||||||
| 1994 | 145 | 314 | ||||||||||
| 1995 | 0 | 46 | 611 | 0 | 302 | 470 | 0 | 0 | 731 | 273 | 634 | 0 |
| 1996 | 303 | 0 | 150 | 272 | 296 | 287 | 0 | 0 | 171 | 169 | 143 | 0 |
| 1997 | 285 | 498 | 631 | 0 | 0 | 0 | 295 | 0 | 0 | 0 | 0 | 0 |
| 1998 | 0 | 0 | 0 | 0 | 6 | 0 | 93 | 0 | 298 | 152 | 409 | 133 |
| 1999 | 270 | 143 | 418 | 263 | 476 | 438 | 102 | 385 | 242 | 0 | 410 | 250 |
| 2000 | 786 | 382 | 0 | 0 | 405 | 270 | 0 | 0 | 0 | 50 | 0 | 463 |
| 2001 | 242 | 270 | 250 | 0 | 351 | 262 | 216 | 0 | 215 | 192 | 201 | 493 |
| 2002 | 321 | 308 | 0 | 25 | 99 | 0 | 48 | 0 | 0 | 971 | 209 | 319 |
| 2003 | 0 | 324 | 0 | 0 | 0 | 161 | 275 | 617 | 150 | 41 | 0 | 0 |
| 2004 | 0 | 150 | ||||||||||
| 2005 | 199 | 172 | 103 | 114 | ||||||||
| 2006 | 167 | 219 | 183 | 195 | 172 | 100 | 162 | 165 | ||||
| 2007 | 175 | 112 | 210 | 232 | 237 | 139 | 630 | 63 | 68 | 40 | ||
| 2008 | 48 | 66 | 86 | 99 | 421 | 397 | 186 | 5 | 498 | 113 | 211 | 509 |
| 2009 | 1,040 | 1,285 | 355 | 604 | 358 | 334 | 36 | 340 | 312 | 576 | 1,245 | 302 |
| 2010 | 582 | 540 | 544 | 594 | 23 | 333 | 661 | 301 | 271 | 575 | ||
| 2011 | 958 | 337 | 199 | 247 | 74 | 405 | ||||||
| 2012 | 270 | 202 | 301 | 300 | 284 | 451 | 541 | |||||
| 2013 | 170 | 502 | 300 | 320 | 270 | 300 | 776 | |||||
| 2014 | 601 | 301 | 604 | 299 | 27 | 123 | 352 | 300 | 603 | 602 | 504 | |
| 2015 | 1 | 5 | 255 | 353 | 24 | 75 | ||||||
| 2016 | 300 | 0 | 0 | 882 | 738 | 615 | 567 | 175 | ||||
| 2017 | 302 | 79 | 478 | 160 | 299 | 160 | 25 | |||||
| 2018 | 40 | 324 | 924 | 363 | 136 | 310 | 76 | 100 | ||||
| 2019 | 310 | 25 | 330 | 405 | 146 | 323 | 296 | |||||
| 2020 | 300 | 269 | 776 | 271 | ||||||||
| 2021 | 270 | 165 | 270 | |||||||||
| 2022 | 270 | 230 | 231 | 230 | 230 | 130 | 251 | |||||
| 2023 | 230 | 215 | 21 | |||||||||
| - = No Data Reported; -- = Not Applicable; NA = Not Available; W = Withheld to avoid disclosure of individual company data. |
| Release Date: 3/29/2024 |
| Next Release Date: 4/30/2024 |