|
Download Data (XLS File) |
|
||||||||
|
||||||||
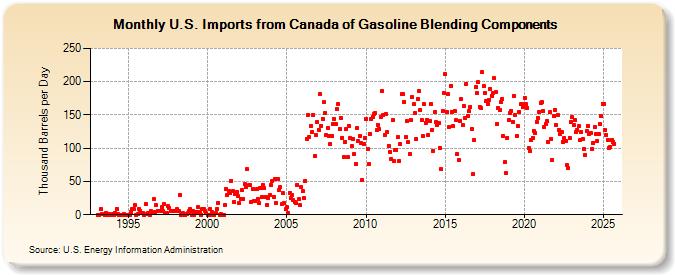
| U.S. Imports from Canada of Gasoline Blending Components (Thousand Barrels per Day) | ||||||||
| Year | Jan | Feb | Mar | Apr | May | Jun | Jul | Aug | Sep | Oct | Nov | Dec |
|---|---|---|---|---|---|---|---|---|---|---|---|---|
| 1993 | 0 | 0 | 8 | 1 | 0 | 3 | 0 | 1 | 0 | 0 | ||
| 1994 | 1 | 0 | 3 | 9 | 1 | 0 | 0 | 0 | 0 | 1 | 0 | |
| 1995 | 0 | 0 | 4 | 9 | 8 | 14 | 0 | 1 | 9 | 6 | 2 | 3 |
| 1996 | 0 | 16 | 1 | 2 | 0 | 5 | 3 | 23 | 4 | 14 | 6 | 6 |
| 1997 | 5 | 11 | 5 | 16 | 3 | 2 | 13 | 10 | 5 | 5 | 5 | 5 |
| 1998 | 6 | 8 | 6 | 30 | 0 | 2 | 0 | 0 | 1 | 2 | 5 | 8 |
| 1999 | 0 | 5 | 0 | 4 | 4 | 11 | 4 | 0 | 8 | 9 | 6 | 2 |
| 2000 | 0 | 0 | 8 | 4 | 0 | 0 | 2 | 9 | 18 | 0 | 1 | 0 |
| 2001 | 0 | 14 | 39 | 30 | 35 | 32 | 51 | 35 | 19 | 31 | 34 | 28 |
| 2002 | 17 | 24 | 37 | 24 | 46 | 41 | 68 | 44 | 45 | 19 | 39 | 20 |
| 2003 | 20 | 38 | 24 | 17 | 40 | 27 | 45 | 40 | 27 | 15 | 25 | 29 |
| 2004 | 44 | 50 | 27 | 53 | 18 | 54 | 37 | 41 | 16 | 32 | 17 | 8 |
| 2005 | 11 | 2 | 33 | 25 | 30 | 22 | 19 | 17 | 45 | 23 | 14 | 41 |
| 2006 | 35 | 25 | 51 | 114 | 150 | 117 | 134 | 124 | 150 | 88 | 120 | 139 |
| 2007 | 128 | 181 | 134 | 144 | 169 | 153 | 120 | 131 | 119 | 106 | 119 | 137 |
| 2008 | 144 | 136 | 159 | 166 | 129 | 146 | 116 | 87 | 110 | 129 | 86 | 134 |
| 2009 | 115 | 103 | 114 | 91 | 76 | 130 | 111 | 118 | 108 | 52 | 106 | 115 |
| 2010 | 144 | 99 | 76 | 122 | 144 | 147 | 152 | 153 | 127 | 135 | 129 | 147 |
| 2011 | 186 | 150 | 120 | 152 | 124 | 104 | 95 | 83 | 142 | 80 | 98 | 98 |
| 2012 | 117 | 81 | 106 | 181 | 181 | 170 | 117 | 141 | 109 | 92 | 142 | 177 |
| 2013 | 166 | 153 | 114 | 174 | 186 | 158 | 143 | 118 | 166 | 138 | 143 | 120 |
| 2014 | 141 | 167 | 128 | 96 | 155 | 139 | 135 | 138 | 101 | 68 | 156 | 183 |
| 2015 | 211 | 155 | 181 | 132 | 194 | 155 | 133 | 156 | 142 | 91 | 82 | 141 |
| 2016 | 174 | 135 | 164 | 146 | 197 | 148 | 156 | 162 | 129 | 61 | 112 | 192 |
| 2017 | 183 | 199 | 162 | 160 | 214 | 193 | 183 | 171 | 167 | 173 | 189 | 179 |
| 2018 | 183 | 205 | 184 | 136 | 161 | 158 | 169 | 174 | 118 | 79 | 62 | 116 |
| 2019 | 143 | 153 | 156 | 140 | 179 | 150 | 119 | 133 | 155 | 166 | 166 | 162 |
| 2020 | 176 | 166 | 161 | 100 | 96 | 112 | 116 | 126 | 123 | 140 | 146 | 155 |
| 2021 | 168 | 169 | 156 | 132 | 137 | 141 | 110 | 154 | 114 | 82 | 149 | 158 |
| 2022 | 135 | 150 | 128 | 122 | 125 | 109 | 115 | 111 | 74 | 70 | 116 | 140 |
| 2023 | 147 | 135 | 142 | 125 | 128 | 132 | 112 | 125 | 114 | 99 | 89 | 125 |
| 2024 | 134 | |||||||||||
| - = No Data Reported; -- = Not Applicable; NA = Not Available; W = Withheld to avoid disclosure of individual company data. |
| Release Date: 3/29/2024 |
| Next Release Date: 4/30/2024 |