|
Download Data (XLS File) |
|
||||||||
|
||||||||
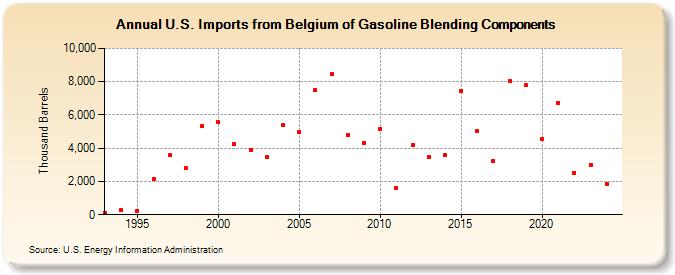
| U.S. Imports from Belgium of Gasoline Blending Components (Thousand Barrels) | ||||||||
| Decade | Year-0 | Year-1 | Year-2 | Year-3 | Year-4 | Year-5 | Year-6 | Year-7 | Year-8 | Year-9 |
|---|---|---|---|---|---|---|---|---|---|---|
| 1990's | 123 | 260 | 248 | 2,134 | 3,562 | 2,837 | 5,345 | |||
| 2000's | 5,570 | 4,240 | 3,890 | 3,476 | 5,380 | 4,966 | 7,502 | 8,440 | 4,769 | 4,318 |
| 2010's | 5,146 | 1,599 | 4,199 | 3,477 | 3,576 | 7,468 | 5,009 | 3,244 | 8,049 | 7,784 |
| 2020's | 4,580 | 6,702 | 2,514 | 2,991 |
| - = No Data Reported; -- = Not Applicable; NA = Not Available; W = Withheld to avoid disclosure of individual company data. |
| Release Date: 3/29/2024 |
| Next Release Date: 8/30/2024 |