|
Download Data (XLS File) |
|
||||||||
|
||||||||
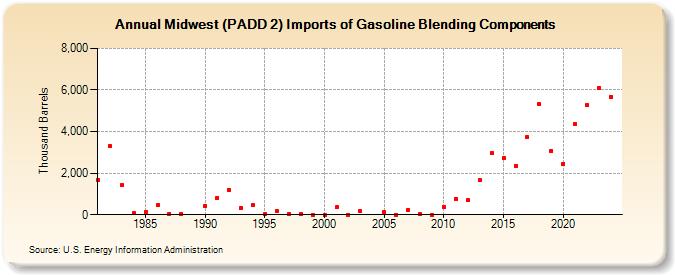
| Midwest (PADD 2) Imports of Gasoline Blending Components (Thousand Barrels) | ||||||||
| Decade | Year-0 | Year-1 | Year-2 | Year-3 | Year-4 | Year-5 | Year-6 | Year-7 | Year-8 | Year-9 |
|---|---|---|---|---|---|---|---|---|---|---|
| 1980's | 1,691 | 3,309 | 1,420 | 75 | 134 | 456 | 50 | 41 | ||
| 1990's | 437 | 820 | 1,199 | 335 | 460 | 13 | 188 | 45 | 33 | 0 |
| 2000's | 0 | 349 | 0 | 163 | 139 | 2 | 231 | 31 | 5 | |
| 2010's | 385 | 763 | 692 | 1,659 | 2,966 | 2,745 | 2,356 | 3,730 | 5,311 | 3,066 |
| 2020's | 2,462 | 4,357 | 5,269 | 6,107 | 5,667 |
| - = No Data Reported; -- = Not Applicable; NA = Not Available; W = Withheld to avoid disclosure of individual company data. |
| Release Date: 6/30/2025 |
| Next Release Date: 8/29/2025 |