|
Download Data (XLS File) |
|
||||||||
|
||||||||
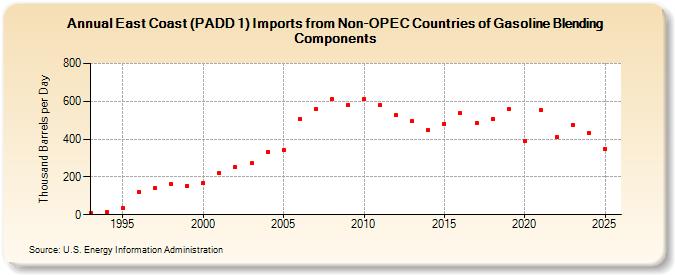
| East Coast (PADD 1) Imports from Non-OPEC Countries of Gasoline Blending Components (Thousand Barrels per Day) | ||||||||
| Decade | Year-0 | Year-1 | Year-2 | Year-3 | Year-4 | Year-5 | Year-6 | Year-7 | Year-8 | Year-9 |
|---|---|---|---|---|---|---|---|---|---|---|
| 1990's | 11 | 14 | 34 | 122 | 140 | 160 | 154 | |||
| 2000's | 167 | 220 | 251 | 272 | 334 | 341 | 506 | 560 | 612 | 582 |
| 2010's | 612 | 581 | 527 | 494 | 446 | 481 | 537 | 487 | 506 | 559 |
| 2020's | 389 | 552 | 410 | 476 |
| - = No Data Reported; -- = Not Applicable; NA = Not Available; W = Withheld to avoid disclosure of individual company data. |
| Release Date: 8/30/2024 |
| Next Release Date: 8/29/2025 |