|
Download Data (XLS File) |
|
||||||||
|
||||||||
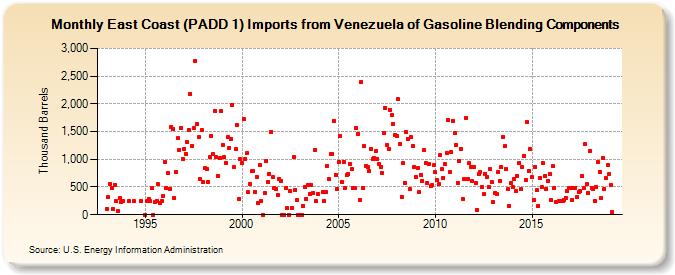
| East Coast (PADD 1) Imports from Venezuela of Gasoline Blending Components (Thousand Barrels) | ||||||||
| Year | Jan | Feb | Mar | Apr | May | Jun | Jul | Aug | Sep | Oct | Nov | Dec |
|---|---|---|---|---|---|---|---|---|---|---|---|---|
| 1993 | 110 | 319 | 561 | 479 | 99 | 541 | 239 | 70 | 308 | 230 | 240 | |
| 1994 | 241 | 240 | 239 | |||||||||
| 1995 | 0 | 239 | 284 | 241 | 478 | 0 | 229 | 239 | 547 | 217 | 251 | 345 |
| 1996 | 957 | 478 | 757 | 471 | 1,579 | 1,545 | 303 | 772 | 1,375 | 1,176 | 1,564 | 997 |
| 1997 | 1,185 | 1,101 | 1,304 | 1,526 | 2,175 | 1,245 | 1,559 | 2,769 | 1,635 | 1,394 | 640 | 1,529 |
| 1998 | 588 | 842 | 816 | 599 | 1,035 | 1,421 | 1,095 | 1,866 | 1,034 | 707 | 1,018 | 1,869 |
| 1999 | 1,261 | 1,034 | 935 | 1,395 | 1,203 | 1,365 | 1,971 | 860 | 1,177 | 1,620 | 280 | 1,003 |
| 2000 | 927 | 1,720 | 1,011 | 1,108 | 403 | 556 | 781 | 792 | 415 | 688 | 208 | 889 |
| 2001 | 239 | 0 | 392 | 977 | 597 | 741 | 1,493 | 678 | 481 | 460 | 355 | 648 |
| 2002 | 611 | 0 | 0 | 478 | 120 | 0 | 423 | 125 | 1,047 | 447 | 260 | 0 |
| 2003 | 0 | 0 | 165 | 498 | 291 | 532 | 374 | 542 | 396 | 1,168 | 247 | 375 |
| 2004 | 403 | 245 | 410 | 880 | 640 | 1,088 | 1,091 | 1,693 | 719 | 470 | ||
| 2005 | 957 | 1,419 | 590 | 959 | 480 | 721 | 728 | 922 | 822 | 480 | 474 | 1,566 |
| 2006 | 1,462 | 270 | 2,393 | 490 | 1,233 | 875 | 854 | 788 | 1,183 | 1,008 | 1,029 | 1,141 |
| 2007 | 1,009 | 913 | 858 | 754 | 1,474 | 1,931 | 1,254 | 1,193 | 1,894 | 1,790 | 1,635 | 1,442 |
| 2008 | 1,412 | 2,079 | 1,272 | 322 | 932 | 579 | 1,496 | 1,372 | 458 | 1,397 | 1,241 | 861 |
| 2009 | 683 | 844 | 403 | 717 | 614 | 1,160 | 934 | 574 | 920 | 511 | 533 | 889 |
| 2010 | 765 | 621 | 553 | 1,079 | 818 | 670 | 912 | 1,121 | 1,704 | 773 | 1,127 | 1,699 |
| 2011 | 1,470 | 1,259 | 580 | 976 | 1,190 | 292 | 642 | 1,753 | 650 | 928 | 857 | 606 |
| 2012 | 869 | 574 | 92 | 728 | 767 | 506 | 367 | 741 | 674 | 501 | 828 | 584 |
| 2013 | 230 | 396 | 380 | 773 | 611 | 854 | 1,408 | 1,236 | 822 | 455 | 164 | 574 |
| 2014 | 507 | 639 | 421 | 699 | 929 | 455 | 862 | 1,060 | 634 | 1,669 | 797 | 1,188 |
| 2015 | 673 | 266 | 866 | 438 | 161 | 659 | 503 | 925 | 698 | 463 | 615 | 733 |
| 2016 | 266 | 871 | 487 | 237 | 242 | 240 | 239 | 273 | 309 | 420 | 483 | |
| 2017 | 487 | 270 | 478 | 487 | 317 | 402 | 419 | 703 | 485 | 1,270 | 552 | 396 |
| 2018 | 1,154 | 486 | 465 | 246 | 496 | 943 | 770 | 301 | 1,029 | 464 | 657 | 890 |
| 2019 | 732 | 532 | 42 | |||||||||
| - = No Data Reported; -- = Not Applicable; NA = Not Available; W = Withheld to avoid disclosure of individual company data. |
| Release Date: 6/28/2024 |
| Next Release Date: 7/31/2024 |