|
Download Data (XLS File) |
|
||||||||
|
||||||||
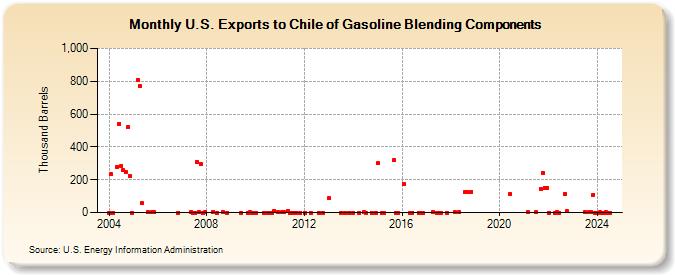
| U.S. Exports to Chile of Gasoline Blending Components (Thousand Barrels) | ||||||||
| Year | Jan | Feb | Mar | Apr | May | Jun | Jul | Aug | Sep | Oct | Nov | Dec |
|---|---|---|---|---|---|---|---|---|---|---|---|---|
| 2004 | 0 | 232 | 0 | 280 | 541 | 283 | 257 | 250 | 521 | 225 | 0 | |
| 2005 | 808 | 768 | 56 | 1 | 1 | 1 | ||||||
| 2006 | 0 | |||||||||||
| 2007 | 1 | 0 | 0 | 310 | 1 | 296 | 0 | 1 | ||||
| 2008 | 1 | 0 | 1 | 0 | ||||||||
| 2009 | 0 | 0 | 1 | 0 | ||||||||
| 2010 | 0 | 0 | 0 | 0 | 0 | 8 | 2 | |||||
| 2011 | 1 | 1 | 8 | 0 | 0 | 0 | 0 | 0 | ||||
| 2012 | 0 | 0 | 0 | 0 | ||||||||
| 2013 | 86 | 0 | 0 | 0 | ||||||||
| 2014 | 0 | 0 | 1 | 0 | 0 | 0 | ||||||
| 2015 | 300 | 0 | 0 | 320 | 0 | 0 | ||||||
| 2016 | 173 | 0 | 0 | 0 | 0 | 0 | ||||||
| 2017 | 1 | 0 | 0 | 0 | 0 | |||||||
| 2018 | 1 | 1 | 128 | 128 | 128 | |||||||
| 2020 | 114 | |||||||||||
| 2021 | 1 | 1 | 145 | 244 | 150 | 152 | ||||||
| 2022 | 0 | 0 | 1 | 0 | 113 | 7 | ||||||
| 2023 | 1 | 1 | 2 | 110 | 0 | |||||||
| 2024 | 0 | |||||||||||
| - = No Data Reported; -- = Not Applicable; NA = Not Available; W = Withheld to avoid disclosure of individual company data. |
| Release Date: 3/29/2024 |
| Next Release Date: 4/30/2024 |