|
Download Data (XLS File) |
|
||||||||
|
||||||||
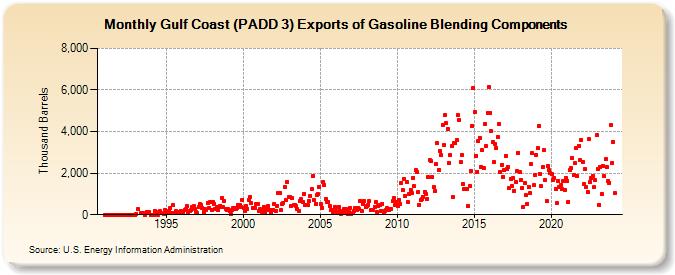
| Gulf Coast (PADD 3) Exports of Gasoline Blending Components (Thousand Barrels) | ||||||||
| Year | Jan | Feb | Mar | Apr | May | Jun | Jul | Aug | Sep | Oct | Nov | Dec |
|---|---|---|---|---|---|---|---|---|---|---|---|---|
| 1991 | 0 | 0 | 0 | 0 | 0 | 0 | 0 | 0 | 0 | 0 | 0 | 0 |
| 1992 | 0 | 0 | 0 | 0 | 0 | 0 | 0 | 0 | 0 | 0 | 0 | 0 |
| 1993 | 13 | 254 | 81 | 94 | 71 | 0 | 153 | 151 | ||||
| 1994 | 0 | 1 | 1 | 185 | 126 | 2 | 162 | 75 | 53 | 238 | ||
| 1995 | 71 | 135 | 167 | 309 | 103 | 455 | 64 | 165 | 125 | 120 | 104 | 195 |
| 1996 | 101 | 67 | 233 | 260 | 401 | 77 | 184 | 212 | 354 | 397 | 283 | 147 |
| 1997 | 62 | 381 | 500 | 444 | 330 | 133 | 253 | 250 | 578 | 300 | 595 | 209 |
| 1998 | 588 | 523 | 266 | 365 | 249 | 360 | 431 | 817 | 349 | 668 | 287 | 221 |
| 1999 | 270 | 159 | 49 | 242 | 306 | 340 | 254 | 333 | 460 | 474 | 394 | 718 |
| 2000 | 327 | 192 | 420 | 295 | 711 | 840 | 552 | 325 | 315 | 314 | 504 | 526 |
| 2001 | 192 | 255 | 147 | 204 | 361 | 140 | 261 | 409 | 242 | 99 | 249 | 248 |
| 2002 | 525 | 188 | 433 | 1,037 | 1,065 | 209 | 523 | 577 | 1,348 | 731 | 1,592 | 841 |
| 2003 | 865 | 417 | 801 | 465 | 459 | 416 | 260 | 187 | 678 | 732 | 631 | 1,014 |
| 2004 | 476 | 447 | 469 | 662 | 908 | 1,239 | 1,870 | 700 | 504 | 947 | 982 | 1,346 |
| 2005 | 519 | 346 | 1,560 | 1,446 | 754 | 618 | 630 | 420 | 204 | 230 | 109 | 389 |
| 2006 | 181 | 143 | 369 | 183 | 26 | 66 | 258 | 83 | 269 | 22 | 137 | 346 |
| 2007 | 43 | 68 | 178 | 305 | 247 | 337 | 274 | 669 | 156 | 522 | 638 | 394 |
| 2008 | 427 | 474 | 646 | 229 | 243 | 229 | 393 | 595 | 122 | 407 | 461 | 198 |
| 2009 | 532 | 128 | 199 | 217 | 329 | 228 | 263 | 279 | 651 | 797 | 458 | 592 |
| 2010 | 428 | 706 | 496 | 1,515 | 1,195 | 1,738 | 922 | 1,553 | 602 | 1,010 | 1,195 | 1,034 |
| 2011 | 1,788 | 1,365 | 2,128 | 2,041 | 1,082 | 487 | 686 | 732 | 872 | 1,106 | 993 | 777 |
| 2012 | 1,809 | 2,630 | 2,582 | 1,812 | 1,313 | 1,143 | 2,427 | 3,437 | 2,154 | 3,050 | 2,858 | 4,323 |
| 2013 | 3,343 | 4,801 | 4,400 | 4,138 | 2,505 | 2,866 | 3,314 | 846 | 3,430 | 3,441 | 3,607 | 4,782 |
| 2014 | 4,541 | 2,522 | 2,876 | 1,481 | 1,257 | 1,223 | 1,249 | 432 | 1,378 | 2,108 | 4,276 | 6,078 |
| 2015 | 4,934 | 2,843 | 2,076 | 3,560 | 3,700 | 2,313 | 3,103 | 2,251 | 4,384 | 3,289 | 4,904 | 6,147 |
| 2016 | 4,892 | 4,025 | 3,494 | 2,539 | 3,412 | 3,218 | 3,756 | 4,377 | 2,078 | 2,407 | 1,833 | 2,135 |
| 2017 | 2,829 | 2,215 | 2,315 | 1,274 | 1,725 | 1,381 | 1,755 | 1,162 | 1,573 | 2,107 | 2,987 | 2,043 |
| 2018 | 1,679 | 1,281 | 392 | 1,525 | 932 | 537 | 1,337 | 1,030 | 2,421 | 2,952 | 1,406 | 1,931 |
| 2019 | 2,893 | 3,187 | 4,287 | 1,967 | 1,358 | 2,286 | 3,101 | 1,671 | 653 | 2,360 | 2,129 | 2,026 |
| 2020 | 1,947 | 1,661 | 1,789 | 1,231 | 552 | 1,635 | 1,353 | 1,453 | 1,233 | 1,645 | 1,197 | 1,771 |
| 2021 | 1,633 | 627 | 2,145 | 2,233 | 2,741 | 1,898 | 2,467 | 3,187 | 1,858 | 3,297 | 2,610 | 3,608 |
| 2022 | 2,543 | 1,466 | 2,184 | 1,311 | 1,093 | 3,624 | 1,590 | 1,763 | 1,870 | 1,309 | 1,664 | 3,815 |
| 2023 | 2,196 | 480 | 2,316 | 1,018 | 2,334 | 1,860 | 2,656 | 2,306 | 1,598 | 1,545 | 4,307 | 2,488 |
| 2024 | 3,514 | |||||||||||
| - = No Data Reported; -- = Not Applicable; NA = Not Available; W = Withheld to avoid disclosure of individual company data. |
| Release Date: 3/29/2024 |
| Next Release Date: 4/30/2024 |