|
Download Data (XLS File) |
|
||||||||
|
||||||||
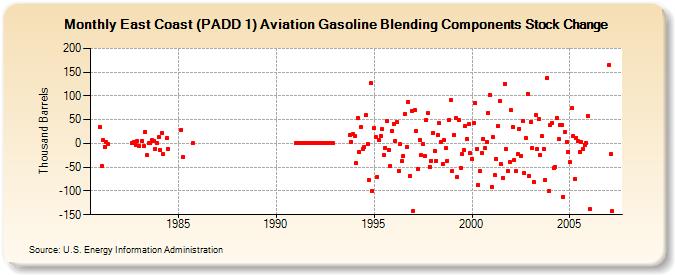
| East Coast (PADD 1) Aviation Gasoline Blending Components Stock Change (Thousand Barrels) | ||||||||
| Year | Jan | Feb | Mar | Apr | May | Jun | Jul | Aug | Sep | Oct | Nov | Dec |
|---|---|---|---|---|---|---|---|---|---|---|---|---|
| 1981 | 35 | -48 | 7 | -7 | 2 | -2 | ||||||
| 1982 | 0 | 4 | -4 | 5 | ||||||||
| 1983 | -5 | 5 | -5 | 25 | -25 | 0 | 0 | 7 | 5 | -12 | 0 | |
| 1984 | 13 | -13 | 23 | -23 | 11 | -11 | ||||||
| 1985 | 29 | -29 | 0 | |||||||||
| 1991 | 0 | 0 | 0 | 0 | 0 | 0 | 0 | 0 | 0 | 0 | 0 | 0 |
| 1992 | 0 | 0 | 0 | 0 | 0 | 0 | 0 | 0 | 0 | 0 | 0 | 0 |
| 1993 | 18 | 4 | 20 | |||||||||
| 1994 | 16 | -42 | 54 | -19 | 35 | -12 | -8 | 59 | -1 | -77 | 127 | -100 |
| 1995 | 32 | 13 | -70 | 7 | 16 | 30 | -25 | -9 | 47 | -14 | -47 | 26 |
| 1996 | 41 | 5 | 45 | -57 | -2 | -37 | -26 | 62 | -7 | 88 | -68 | 69 |
| 1997 | -142 | 70 | 26 | -53 | 8 | -25 | -1 | -26 | 50 | 64 | -49 | -36 |
| 1998 | 22 | -15 | -36 | 18 | 42 | 3 | -43 | 7 | -10 | -36 | 50 | 92 |
| 1999 | -58 | 18 | 53 | -71 | 49 | -51 | -23 | -14 | 37 | 10 | 41 | -21 |
| 2000 | -33 | 42 | 85 | -11 | -88 | -59 | -20 | 10 | -10 | 3 | 65 | 102 |
| 2001 | -91 | 13 | -67 | -33 | 37 | 89 | -44 | -72 | 126 | -12 | -58 | -40 |
| 2002 | 70 | 35 | -35 | -59 | -23 | 31 | -27 | 48 | -63 | 11 | 105 | -68 |
| 2003 | 45 | -9 | -81 | 60 | -12 | 51 | -24 | 15 | -11 | -76 | 138 | -101 |
| 2004 | 39 | 44 | -52 | -49 | 54 | 9 | 39 | 38 | -112 | 25 | 4 | -18 |
| 2005 | -40 | 74 | 16 | -75 | 12 | 5 | -18 | 3 | -12 | -3 | 1 | 58 |
| 2006 | -139 | |||||||||||
| 2007 | 166 | -23 | -143 | |||||||||
| - = No Data Reported; -- = Not Applicable; NA = Not Available; W = Withheld to avoid disclosure of individual company data. |
| Release Date: 6/30/2025 |
| Next Release Date: 7/31/2025 |