|
Download Data (XLS File) |
|
||||||||
|
||||||||
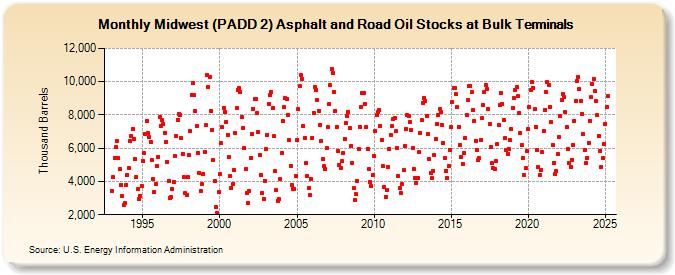
| Midwest (PADD 2) Asphalt and Road Oil Stocks at Bulk Terminals (Thousand Barrels) | ||||||||
| Year | Jan | Feb | Mar | Apr | May | Jun | Jul | Aug | Sep | Oct | Nov | Dec |
|---|---|---|---|---|---|---|---|---|---|---|---|---|
| 1993 | 3,433 | 4,238 | 5,400 | 6,066 | 6,407 | 5,421 | 4,729 | 3,810 | 3,103 | 2,562 | 2,681 | 3,790 |
| 1994 | 4,394 | 4,822 | 6,404 | 6,739 | 7,173 | 6,539 | 5,338 | 4,248 | 3,516 | 2,932 | 3,138 | 3,731 |
| 1995 | 5,230 | 5,687 | 6,881 | 7,614 | 6,924 | 6,652 | 6,368 | 5,274 | 4,157 | 3,369 | 3,823 | 4,922 |
| 1996 | 5,475 | 7,866 | 7,353 | 7,717 | 7,455 | 6,902 | 6,395 | 5,176 | 4,023 | 3,027 | 3,078 | 3,553 |
| 1997 | 3,994 | 5,545 | 6,737 | 7,698 | 8,060 | 7,992 | 6,612 | 5,669 | 4,238 | 3,290 | 3,196 | 4,266 |
| 1998 | 5,588 | 7,030 | 9,214 | 9,927 | 9,180 | 8,234 | 7,307 | 5,717 | 4,495 | 3,422 | 3,843 | 4,464 |
| 1999 | 5,762 | 7,378 | 10,385 | 9,658 | 10,305 | 8,219 | 7,088 | 5,281 | 4,007 | 2,460 | 2,130 | 3,359 |
| 2000 | 4,424 | 6,299 | 7,249 | 8,439 | 8,203 | 7,593 | 6,821 | 5,477 | 4,344 | 3,604 | 3,853 | 4,715 |
| 2001 | 6,913 | 8,398 | 9,482 | 9,594 | 9,395 | 7,867 | 7,239 | 6,006 | 4,744 | 3,309 | 2,700 | 3,400 |
| 2002 | 5,427 | 6,838 | 8,383 | 8,928 | 8,963 | 8,124 | 6,944 | 5,591 | 4,385 | 3,305 | 2,919 | 4,056 |
| 2003 | 5,946 | 6,811 | 8,661 | 9,179 | 9,401 | 8,415 | 6,732 | 4,624 | 3,456 | 2,845 | 2,943 | 4,135 |
| 2004 | 5,700 | 7,609 | 8,454 | 9,013 | 8,928 | 8,002 | 6,480 | 4,917 | 3,815 | 3,562 | 3,553 | 4,344 |
| 2005 | 6,485 | 8,327 | 9,719 | 10,393 | 10,146 | 7,358 | 6,639 | 5,105 | 4,326 | 3,607 | 3,188 | 4,132 |
| 2006 | 6,641 | 8,139 | 9,691 | 9,508 | 8,892 | 8,263 | 7,403 | 6,403 | 5,334 | 4,905 | 4,759 | 5,986 |
| 2007 | 7,265 | 8,636 | 9,771 | 10,742 | 10,537 | 9,407 | 8,258 | 7,273 | 5,839 | 4,994 | 4,816 | 5,207 |
| 2008 | 5,712 | 6,564 | 7,504 | 7,959 | 8,201 | 7,235 | 6,138 | 5,134 | 3,580 | 2,876 | 3,225 | 4,055 |
| 2009 | 5,949 | 7,280 | 8,493 | 9,290 | 9,318 | 8,684 | 7,288 | 5,967 | 4,736 | 3,984 | 3,707 | 4,366 |
| 2010 | 5,515 | 7,008 | 7,983 | 8,184 | 8,282 | 7,358 | 6,512 | 4,910 | 3,673 | 3,059 | 3,481 | 4,869 |
| 2011 | 5,952 | 6,798 | 7,350 | 7,736 | 7,829 | 7,015 | 6,010 | 4,315 | 3,580 | 3,315 | 3,859 | 4,672 |
| 2012 | 6,144 | 7,166 | 7,977 | 7,945 | 7,587 | 7,082 | 6,004 | 4,754 | 4,207 | 3,919 | 4,235 | 5,763 |
| 2013 | 6,884 | 7,679 | 8,721 | 9,038 | 8,851 | 7,907 | 6,859 | 5,327 | 4,534 | 4,215 | 4,647 | 5,573 |
| 2014 | 6,574 | 7,450 | 7,967 | 8,326 | 8,195 | 7,408 | 6,325 | 5,383 | 4,657 | 4,210 | 4,899 | 5,909 |
| 2015 | 7,285 | 8,748 | 9,618 | 9,623 | 9,233 | 8,473 | 7,289 | 6,169 | 5,446 | 5,051 | 5,731 | 6,622 |
| 2016 | 7,994 | 8,884 | 9,727 | 9,763 | 9,349 | 8,266 | 7,625 | 6,457 | 5,920 | 5,288 | 5,392 | 6,490 |
| 2017 | 7,811 | 8,581 | 9,405 | 9,777 | 9,545 | 8,348 | 7,468 | 6,073 | 5,083 | 4,792 | 4,750 | 5,253 |
| 2018 | 6,226 | 7,381 | 8,596 | 9,291 | 8,673 | 7,723 | 6,611 | 5,890 | 5,655 | 5,956 | 6,478 | 7,149 |
| 2019 | 8,437 | 9,008 | 9,513 | 9,652 | 9,127 | 8,129 | 6,899 | 6,178 | 5,435 | 4,365 | 4,787 | 5,817 |
| 2020 | 7,132 | 8,499 | 9,495 | 9,973 | 9,625 | 8,330 | 7,301 | 5,901 | 4,877 | 4,379 | 4,698 | 5,762 |
| 2021 | 7,056 | 8,325 | 9,405 | 9,954 | 9,824 | 8,505 | 7,550 | 6,221 | 5,130 | 4,465 | 4,636 | 5,674 |
| 2022 | 6,688 | 7,949 | 8,906 | 9,287 | 9,092 | 8,197 | 7,247 | 5,934 | 5,132 | 4,860 | 5,312 | 6,190 |
| 2023 | 7,535 | 8,866 | 10,058 | 10,283 | 9,588 | 8,867 | 8,082 | 6,839 | 5,886 | 5,109 | 5,436 | 6,315 |
| 2024 | 7,654 | |||||||||||
| - = No Data Reported; -- = Not Applicable; NA = Not Available; W = Withheld to avoid disclosure of individual company data. |
| Release Date: 3/29/2024 |
| Next Release Date: 4/30/2024 |