|
Download Data (XLS File) |
|
||||||||
|
||||||||
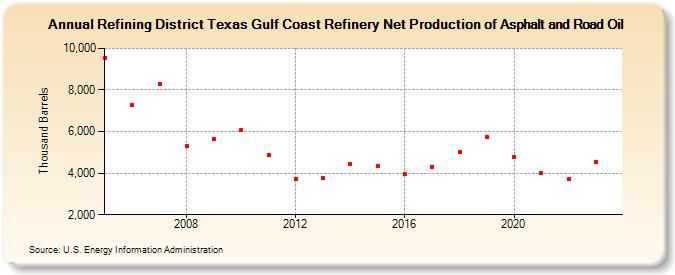
| Refining District Texas Gulf Coast Refinery Net Production of Asphalt and Road Oil (Thousand Barrels) | ||||||||
| Decade | Year-0 | Year-1 | Year-2 | Year-3 | Year-4 | Year-5 | Year-6 | Year-7 | Year-8 | Year-9 |
|---|---|---|---|---|---|---|---|---|---|---|
| 2000's | 9,542 | 7,275 | 8,279 | 5,308 | 5,633 | |||||
| 2010's | 6,061 | 4,866 | 3,728 | 3,782 | 4,423 | 4,321 | 3,981 | 4,311 | 5,006 | 5,724 |
| 2020's | 4,778 | 3,991 | 3,710 | 4,541 |
| - = No Data Reported; -- = Not Applicable; NA = Not Available; W = Withheld to avoid disclosure of individual company data. |
| Release Date: 3/29/2024 |
| Next Release Date: 8/30/2024 |