|
Download Data (XLS File) |
|
||||||||
|
||||||||
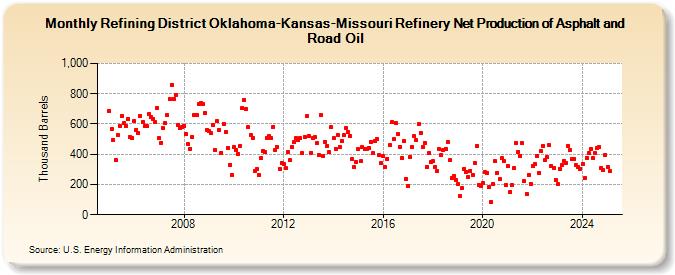
| Refining District Oklahoma-Kansas-Missouri Refinery Net Production of Asphalt and Road Oil (Thousand Barrels) | ||||||||
| Year | Jan | Feb | Mar | Apr | May | Jun | Jul | Aug | Sep | Oct | Nov | Dec |
|---|---|---|---|---|---|---|---|---|---|---|---|---|
| 2005 | 686 | 567 | 496 | 363 | 528 | 589 | 653 | 608 | 588 | 633 | 515 | 506 |
| 2006 | 619 | 559 | 539 | 654 | 612 | 587 | 585 | 663 | 643 | 634 | 611 | 707 |
| 2007 | 506 | 476 | 571 | 607 | 657 | 762 | 860 | 766 | 794 | 596 | 572 | 578 |
| 2008 | 589 | 531 | 466 | 437 | 514 | 662 | 661 | 730 | 740 | 733 | 673 | 562 |
| 2009 | 552 | 538 | 591 | 428 | 617 | 559 | 409 | 601 | 548 | 444 | 332 | 264 |
| 2010 | 446 | 430 | 402 | 456 | 703 | 759 | 700 | 577 | 528 | 504 | 290 | 303 |
| 2011 | 263 | 373 | 418 | 412 | 510 | 520 | 506 | 577 | 428 | 448 | 303 | 344 |
| 2012 | 336 | 306 | 413 | 359 | 448 | 479 | 505 | 494 | 505 | 406 | 514 | 651 |
| 2013 | 521 | 410 | 507 | 511 | 472 | 394 | 659 | 390 | 483 | 455 | 413 | 577 |
| 2014 | 504 | 437 | 529 | 448 | 486 | 525 | 572 | 547 | 520 | 366 | 314 | 349 |
| 2015 | 432 | 352 | 446 | 435 | 433 | 444 | 483 | 405 | 486 | 500 | 393 | 341 |
| 2016 | 386 | 313 | 371 | 458 | 611 | 500 | 604 | 535 | 449 | 377 | 489 | 237 |
| 2017 | 192 | 380 | 451 | 519 | 492 | 597 | 543 | 449 | 474 | 318 | 409 | 348 |
| 2018 | 352 | 316 | 290 | 433 | 396 | 427 | 436 | 484 | 363 | 244 | 259 | 231 |
| 2019 | 202 | 121 | 177 | 304 | 283 | 250 | 291 | 265 | 344 | 455 | 197 | 191 |
| 2020 | 208 | 280 | 279 | 180 | 86 | 204 | 352 | 278 | 234 | 374 | 356 | 199 |
| 2021 | 323 | 151 | 198 | 309 | 475 | 417 | 389 | 473 | 221 | 136 | 265 | 206 |
| 2022 | 322 | 335 | 385 | 279 | 419 | 456 | 359 | 379 | 458 | 323 | 312 | 229 |
| 2023 | 200 | 305 | 330 | 358 | 343 | 456 | 426 | 370 | 370 | 327 | 315 | 303 |
| 2024 | 335 | |||||||||||
| - = No Data Reported; -- = Not Applicable; NA = Not Available; W = Withheld to avoid disclosure of individual company data. |
| Release Date: 3/29/2024 |
| Next Release Date: 4/30/2024 |