|
Download Data (XLS File) |
|
||||||||
|
||||||||
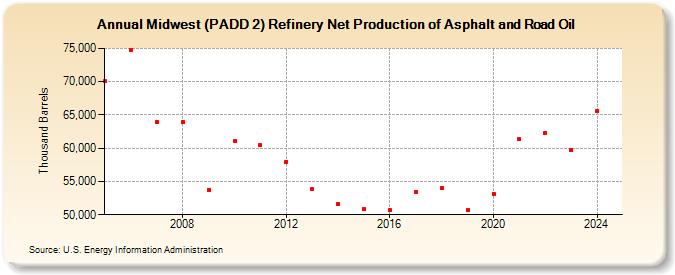
| Midwest (PADD 2) Refinery Net Production of Asphalt and Road Oil (Thousand Barrels) | ||||||||
| Decade | Year-0 | Year-1 | Year-2 | Year-3 | Year-4 | Year-5 | Year-6 | Year-7 | Year-8 | Year-9 |
|---|---|---|---|---|---|---|---|---|---|---|
| 2000's | 70,042 | 74,796 | 63,907 | 63,914 | 53,740 | |||||
| 2010's | 61,005 | 60,416 | 57,986 | 53,826 | 51,598 | 50,830 | 50,648 | 53,478 | 54,007 | 50,667 |
| 2020's | 53,120 | 61,309 | 62,315 | 59,783 |
| - = No Data Reported; -- = Not Applicable; NA = Not Available; W = Withheld to avoid disclosure of individual company data. |
| Release Date: 3/29/2024 |
| Next Release Date: 8/30/2024 |