|
Download Data (XLS File) |
|
||||||||
|
||||||||
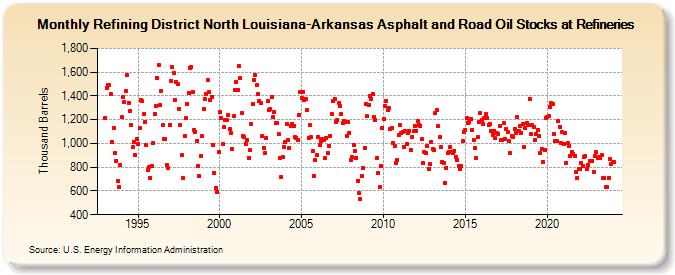
| Refining District North Louisiana-Arkansas Asphalt and Road Oil Stocks at Refineries (Thousand Barrels) | ||||||||
| Year | Jan | Feb | Mar | Apr | May | Jun | Jul | Aug | Sep | Oct | Nov | Dec |
|---|---|---|---|---|---|---|---|---|---|---|---|---|
| 1993 | 1,211 | 1,469 | 1,491 | 1,488 | 1,413 | 1,009 | 1,134 | 919 | 855 | 682 | 633 | 819 |
| 1994 | 1,220 | 1,390 | 1,348 | 1,445 | 1,577 | 1,343 | 1,276 | 1,156 | 967 | 1,011 | 899 | 1,037 |
| 1995 | 998 | 1,126 | 1,367 | 1,357 | 1,247 | 1,184 | 984 | 773 | 799 | 711 | 813 | 1,000 |
| 1996 | 1,249 | 1,315 | 1,552 | 1,656 | 1,325 | 1,444 | 1,152 | 1,038 | 1,039 | 815 | 791 | 1,159 |
| 1997 | 1,528 | 1,642 | 1,594 | 1,365 | 1,517 | 1,499 | 1,286 | 1,151 | 899 | 709 | 1,063 | 1,214 |
| 1998 | 1,330 | 1,421 | 1,637 | 1,645 | 1,435 | 1,116 | 1,099 | 1,019 | 811 | 725 | 894 | 1,059 |
| 1999 | 1,288 | 1,370 | 1,417 | 1,532 | 1,431 | 1,364 | 1,394 | 990 | 753 | 628 | 591 | 924 |
| 2000 | 1,265 | 1,216 | 995 | 1,135 | 1,196 | 1,197 | 1,238 | 1,118 | 1,088 | 956 | 1,228 | 1,447 |
| 2001 | 1,515 | 1,451 | 1,650 | 1,554 | 1,252 | 1,064 | 1,055 | 997 | 1,026 | 879 | 943 | 1,161 |
| 2002 | 1,336 | 1,538 | 1,573 | 1,490 | 1,413 | 1,358 | 1,337 | 1,062 | 965 | 921 | 1,046 | 1,356 |
| 2003 | 1,278 | 1,286 | 1,391 | 1,219 | 1,263 | 1,172 | 1,169 | 1,078 | 881 | 721 | 885 | 971 |
| 2004 | 1,015 | 1,167 | 1,025 | 958 | 1,148 | 1,167 | 1,147 | 1,051 | 1,049 | 1,028 | 1,240 | 1,437 |
| 2005 | 1,383 | 1,436 | 1,369 | 1,377 | 1,279 | 1,046 | 1,152 | 1,052 | 938 | 730 | 858 | 900 |
| 2006 | 1,056 | 988 | 1,024 | 1,037 | 1,029 | 878 | 1,047 | 920 | 979 | 1,066 | 1,249 | 1,355 |
| 2007 | 1,374 | 1,184 | 1,197 | 1,339 | 1,313 | 1,248 | 1,170 | 1,191 | 1,181 | 1,064 | 1,182 | 1,091 |
| 2008 | 861 | 884 | 991 | 935 | 880 | 687 | 583 | 530 | 724 | 790 | 960 | 1,335 |
| 2009 | 1,228 | 1,322 | 1,398 | 1,377 | 1,412 | 1,224 | 1,201 | 877 | 752 | 633 | 814 | 1,127 |
| 2010 | 1,209 | 1,317 | 1,359 | 1,281 | 1,296 | 1,121 | 1,134 | 1,005 | 976 | 836 | 860 | 1,072 |
| 2011 | 1,158 | 1,085 | 1,099 | 974 | 1,104 | 999 | 1,089 | 1,108 | 948 | 1,055 | 1,104 | 1,148 |
| 2012 | 1,105 | 1,187 | 1,158 | 1,149 | 1,037 | 835 | 928 | 920 | 976 | 789 | 824 | 1,010 |
| 2013 | 951 | 943 | 1,258 | 1,280 | 1,146 | 1,055 | 966 | 845 | 839 | 670 | 796 | 917 |
| 2014 | 932 | 974 | 929 | 918 | 940 | 890 | 861 | 814 | 781 | 806 | 1,021 | 1,097 |
| 2015 | 1,116 | 1,213 | 1,174 | 1,182 | 1,204 | 1,112 | 1,032 | 965 | 878 | 1,050 | 1,182 | 1,260 |
| 2016 | 1,198 | 1,166 | 1,213 | 1,244 | 1,212 | 1,159 | 1,164 | 1,107 | 1,072 | 1,107 | 1,042 | 1,084 |
| 2017 | 1,079 | 1,149 | 1,026 | 1,031 | 1,170 | 1,041 | 1,121 | 1,094 | 1,020 | 919 | 1,064 | 1,057 |
| 2018 | 1,122 | 1,092 | 1,219 | 1,108 | 1,145 | 1,086 | 1,163 | 970 | 1,129 | 1,170 | 1,153 | 1,377 |
| 2019 | 1,082 | 1,154 | 1,141 | 1,033 | 1,078 | 1,113 | 1,063 | 918 | 956 | 844 | 941 | 1,213 |
| 2020 | 1,226 | 1,229 | 1,305 | 1,339 | 1,330 | 1,083 | 1,023 | 1,024 | 1,188 | 1,137 | 1,005 | 1,094 |
| 2021 | 998 | 1,084 | 838 | 1,004 | 978 | 894 | 932 | 914 | 896 | 763 | 707 | 781 |
| 2022 | 787 | 836 | 810 | 885 | 897 | 789 | 820 | 851 | 850 | 856 | 762 | 898 |
| 2023 | 924 | 881 | 883 | 876 | 899 | 709 | 709 | 630 | 635 | 713 | 868 | 830 |
| 2024 | 846 | 847 | 866 | 894 | ||||||||
| - = No Data Reported; -- = Not Applicable; NA = Not Available; W = Withheld to avoid disclosure of individual company data. |
| Release Date: 6/28/2024 |
| Next Release Date: 7/31/2024 |