|
Download Data (XLS File) |
|
||||||||
|
||||||||
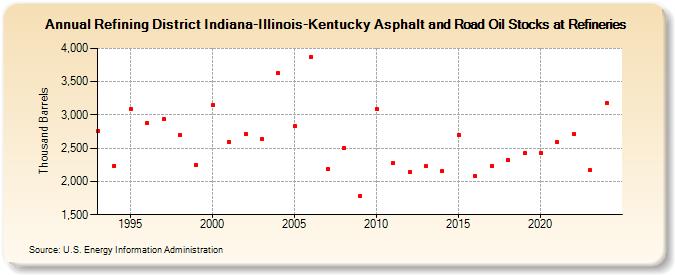
| Refining District Indiana-Illinois-Kentucky Asphalt and Road Oil Stocks at Refineries (Thousand Barrels) | ||||||||
| Decade | Year-0 | Year-1 | Year-2 | Year-3 | Year-4 | Year-5 | Year-6 | Year-7 | Year-8 | Year-9 |
|---|---|---|---|---|---|---|---|---|---|---|
| 1990's | 2,753 | 2,237 | 3,091 | 2,882 | 2,933 | 2,700 | 2,249 | |||
| 2000's | 3,144 | 2,596 | 2,711 | 2,640 | 3,626 | 2,831 | 3,876 | 2,183 | 2,510 | 1,781 |
| 2010's | 3,088 | 2,281 | 2,139 | 2,225 | 2,154 | 2,702 | 2,076 | 2,234 | 2,326 | 2,423 |
| 2020's | 2,430 | 2,586 | 2,718 | 2,167 |
| - = No Data Reported; -- = Not Applicable; NA = Not Available; W = Withheld to avoid disclosure of individual company data. |
| Release Date: 3/29/2024 |
| Next Release Date: 8/30/2024 |