|
Download Data (XLS File) |
|
||||||||
|
||||||||
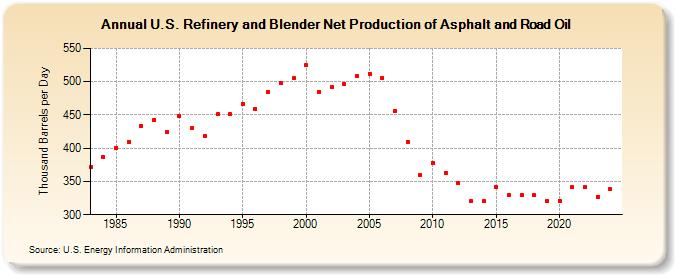
| U.S. Refinery and Blender Net Production of Asphalt and Road Oil (Thousand Barrels per Day) | ||||||||
| Decade | Year-0 | Year-1 | Year-2 | Year-3 | Year-4 | Year-5 | Year-6 | Year-7 | Year-8 | Year-9 |
|---|---|---|---|---|---|---|---|---|---|---|
| 1980's | 372 | 386 | 401 | 410 | 434 | 443 | 424 | |||
| 1990's | 449 | 430 | 419 | 451 | 451 | 467 | 459 | 485 | 498 | 505 |
| 2000's | 525 | 485 | 492 | 496 | 508 | 512 | 506 | 456 | 410 | 359 |
| 2010's | 378 | 363 | 347 | 320 | 320 | 341 | 330 | 330 | 329 | 320 |
| 2020's | 321 | 341 | 341 | 327 |
| - = No Data Reported; -- = Not Applicable; NA = Not Available; W = Withheld to avoid disclosure of individual company data. |
| Release Date: 6/28/2024 |
| Next Release Date: 8/30/2024 |