|
Download Data (XLS File) |
|
||||||||
|
||||||||
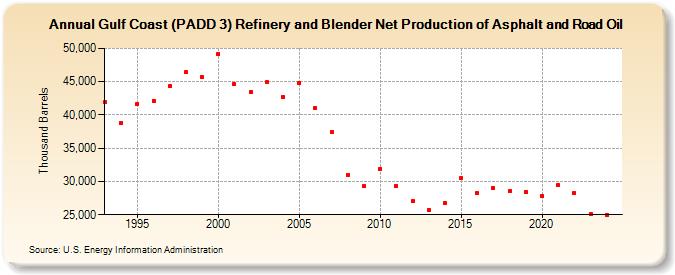
| Gulf Coast (PADD 3) Refinery and Blender Net Production of Asphalt and Road Oil (Thousand Barrels) | ||||||||
| Decade | Year-0 | Year-1 | Year-2 | Year-3 | Year-4 | Year-5 | Year-6 | Year-7 | Year-8 | Year-9 |
|---|---|---|---|---|---|---|---|---|---|---|
| 1990's | 41,879 | 38,823 | 41,666 | 42,118 | 44,330 | 46,404 | 45,683 | |||
| 2000's | 49,231 | 44,582 | 43,434 | 44,906 | 42,766 | 44,871 | 41,021 | 37,360 | 31,010 | 29,258 |
| 2010's | 31,915 | 29,340 | 27,055 | 25,649 | 26,817 | 30,494 | 28,200 | 29,039 | 28,531 | 28,485 |
| 2020's | 27,875 | 29,444 | 28,279 | 25,088 |
| - = No Data Reported; -- = Not Applicable; NA = Not Available; W = Withheld to avoid disclosure of individual company data. |
| Release Date: 3/29/2024 |
| Next Release Date: 8/30/2024 |