|
Download Data (XLS File) |
|
||||||||
|
||||||||
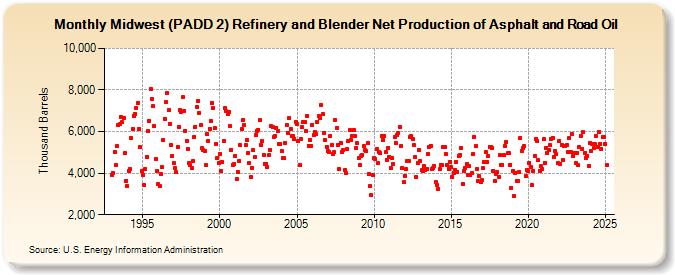
| Midwest (PADD 2) Refinery and Blender Net Production of Asphalt and Road Oil (Thousand Barrels) | ||||||||
| Year | Jan | Feb | Mar | Apr | May | Jun | Jul | Aug | Sep | Oct | Nov | Dec |
|---|---|---|---|---|---|---|---|---|---|---|---|---|
| 1993 | 3,918 | 4,000 | 5,018 | 4,391 | 5,297 | 6,336 | 6,350 | 6,676 | 6,443 | 6,653 | 4,952 | 3,635 |
| 1994 | 3,381 | 4,116 | 4,198 | 5,699 | 6,129 | 6,761 | 6,857 | 7,127 | 7,373 | 6,125 | 5,252 | 4,085 |
| 1995 | 3,920 | 3,421 | 4,216 | 4,788 | 6,045 | 6,529 | 8,070 | 7,575 | 7,216 | 6,262 | 4,676 | 4,100 |
| 1996 | 3,472 | 3,376 | 3,950 | 4,274 | 5,607 | 6,618 | 7,412 | 7,848 | 7,036 | 6,379 | 5,335 | 4,821 |
| 1997 | 4,488 | 4,269 | 4,033 | 5,261 | 6,243 | 7,047 | 6,934 | 7,641 | 6,991 | 6,045 | 5,565 | 5,161 |
| 1998 | 4,510 | 4,372 | 4,233 | 4,592 | 5,722 | 6,240 | 7,193 | 7,463 | 6,915 | 6,293 | 5,187 | 5,101 |
| 1999 | 5,088 | 4,379 | 5,866 | 5,552 | 6,111 | 6,501 | 7,376 | 7,145 | 6,150 | 5,420 | 4,745 | 4,494 |
| 2000 | 4,922 | 4,092 | 4,524 | 5,567 | 7,118 | 6,970 | 6,823 | 6,918 | 6,244 | 5,135 | 4,401 | 4,463 |
| 2001 | 4,832 | 3,733 | 4,046 | 4,589 | 5,333 | 6,123 | 6,567 | 6,322 | 5,376 | 5,588 | 4,978 | 4,466 |
| 2002 | 3,797 | 4,259 | 5,106 | 4,769 | 5,818 | 6,045 | 6,088 | 6,551 | 5,366 | 5,527 | 4,870 | 4,460 |
| 2003 | 4,456 | 4,298 | 4,854 | 5,123 | 6,262 | 6,198 | 5,746 | 5,808 | 6,192 | 6,022 | 5,423 | 5,408 |
| 2004 | 5,069 | 4,721 | 4,720 | 5,453 | 6,303 | 5,931 | 6,642 | 6,132 | 5,806 | 5,778 | 5,643 | 6,479 |
| 2005 | 6,340 | 5,553 | 4,399 | 5,620 | 6,212 | 6,451 | 6,445 | 6,040 | 6,762 | 5,321 | 5,589 | 5,310 |
| 2006 | 6,336 | 5,831 | 5,998 | 5,894 | 6,448 | 6,743 | 6,642 | 7,283 | 6,821 | 5,912 | 5,614 | 5,274 |
| 2007 | 5,055 | 5,002 | 5,807 | 5,351 | 4,937 | 4,996 | 6,562 | 6,171 | 5,368 | 4,187 | 5,454 | 5,017 |
| 2008 | 5,122 | 4,144 | 3,994 | 5,164 | 5,566 | 6,071 | 5,572 | 5,780 | 6,075 | 5,776 | 5,213 | 5,437 |
| 2009 | 4,726 | 4,412 | 4,818 | 4,862 | 5,288 | 5,135 | 5,050 | 5,427 | 3,955 | 3,380 | 2,947 | 3,892 |
| 2010 | 4,718 | 4,668 | 5,142 | 4,485 | 5,003 | 4,959 | 5,784 | 5,602 | 5,789 | 5,008 | 4,653 | 5,223 |
| 2011 | 4,799 | 4,232 | 4,715 | 4,425 | 5,733 | 5,461 | 5,824 | 5,922 | 6,230 | 5,303 | 4,264 | 3,556 |
| 2012 | 3,881 | 4,187 | 4,575 | 4,578 | 5,725 | 5,791 | 5,659 | 5,330 | 4,774 | 3,807 | 4,507 | 5,123 |
| 2013 | 4,578 | 4,134 | 4,095 | 4,325 | 4,158 | 4,198 | 4,916 | 5,278 | 5,325 | 4,199 | 4,233 | 4,342 |
| 2014 | 3,578 | 3,436 | 3,259 | 4,177 | 4,401 | 4,368 | 5,253 | 5,246 | 4,918 | 4,381 | 4,222 | 4,558 |
| 2015 | 4,297 | 3,806 | 4,015 | 4,167 | 4,533 | 4,053 | 4,840 | 4,872 | 5,225 | 3,495 | 4,119 | 4,268 |
| 2016 | 4,427 | 3,926 | 4,332 | 3,897 | 3,991 | 4,912 | 5,757 | 5,290 | 4,200 | 3,613 | 3,845 | 3,558 |
| 2017 | 3,669 | 4,225 | 4,527 | 5,002 | 4,534 | 4,802 | 5,261 | 5,262 | 5,199 | 4,107 | 3,617 | 3,973 |
| 2018 | 4,043 | 3,801 | 4,872 | 4,414 | 4,400 | 4,870 | 5,309 | 5,508 | 4,948 | 4,975 | 4,409 | 3,301 |
| 2019 | 4,093 | 2,890 | 4,019 | 3,632 | 3,622 | 4,050 | 5,694 | 5,088 | 5,222 | 5,327 | 3,842 | 4,170 |
| 2020 | 4,080 | 4,497 | 4,304 | 3,408 | 4,112 | 4,825 | 5,655 | 5,562 | 4,626 | 4,121 | 4,321 | 4,188 |
| 2021 | 5,623 | 4,506 | 5,229 | 4,946 | 5,109 | 5,332 | 5,656 | 5,711 | 4,773 | 5,087 | 4,899 | 4,492 |
| 2022 | 5,533 | 4,457 | 5,377 | 4,621 | 5,286 | 5,324 | 5,360 | 5,026 | 5,698 | 5,040 | 5,893 | 4,804 |
| 2023 | 4,965 | 4,472 | 4,975 | 4,386 | 5,247 | 5,787 | 5,182 | 5,963 | 4,963 | 4,733 | 4,829 | 4,336 |
| 2024 | 5,462 | |||||||||||
| - = No Data Reported; -- = Not Applicable; NA = Not Available; W = Withheld to avoid disclosure of individual company data. |
| Release Date: 3/29/2024 |
| Next Release Date: 4/30/2024 |