|
Download Data (XLS File) |
|
||||||||
|
||||||||
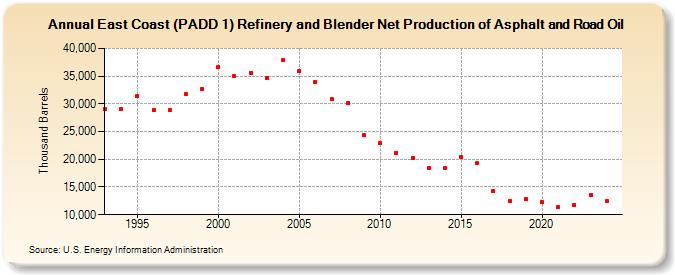
| East Coast (PADD 1) Refinery and Blender Net Production of Asphalt and Road Oil (Thousand Barrels) | ||||||||
| Decade | Year-0 | Year-1 | Year-2 | Year-3 | Year-4 | Year-5 | Year-6 | Year-7 | Year-8 | Year-9 |
|---|---|---|---|---|---|---|---|---|---|---|
| 1990's | 29,096 | 29,058 | 31,375 | 28,903 | 28,867 | 31,711 | 32,594 | |||
| 2000's | 36,689 | 35,063 | 35,645 | 34,685 | 37,873 | 35,838 | 34,012 | 30,785 | 30,097 | 24,342 |
| 2010's | 22,873 | 21,088 | 20,214 | 18,425 | 18,472 | 20,387 | 19,289 | 14,352 | 12,509 | 12,870 |
| 2020's | 12,215 | 11,311 | 11,719 | 13,640 |
| - = No Data Reported; -- = Not Applicable; NA = Not Available; W = Withheld to avoid disclosure of individual company data. |
| Release Date: 8/30/2024 |
| Next Release Date: 8/29/2025 |