|
Download Data (XLS File) |
|
||||||||
|
||||||||
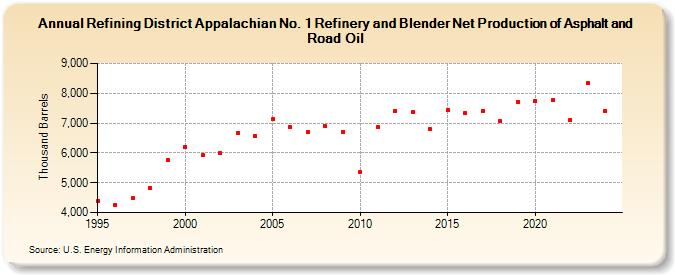
| Refining District Appalachian No. 1 Refinery and Blender Net Production of Asphalt and Road Oil (Thousand Barrels) | ||||||||
| Decade | Year-0 | Year-1 | Year-2 | Year-3 | Year-4 | Year-5 | Year-6 | Year-7 | Year-8 | Year-9 |
|---|---|---|---|---|---|---|---|---|---|---|
| 1990's | 4,385 | 4,246 | 4,475 | 4,839 | 5,769 | |||||
| 2000's | 6,212 | 5,932 | 5,984 | 6,674 | 6,566 | 7,127 | 6,874 | 6,699 | 6,893 | 6,703 |
| 2010's | 5,368 | 6,865 | 7,417 | 7,367 | 6,792 | 7,430 | 7,347 | 7,407 | 7,057 | 7,723 |
| 2020's | 7,735 | 7,763 | 7,118 | 8,341 |
| - = No Data Reported; -- = Not Applicable; NA = Not Available; W = Withheld to avoid disclosure of individual company data. |
| Release Date: 3/29/2024 |
| Next Release Date: 8/30/2024 |