|
Download Data (XLS File) |
|
||||||||
|
||||||||
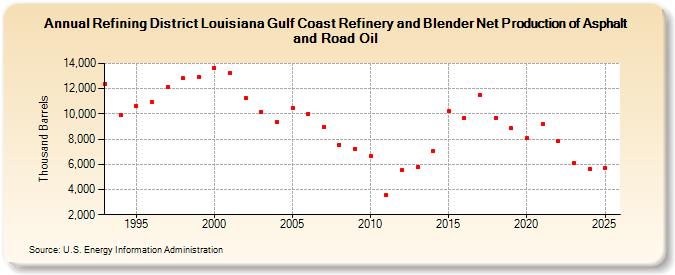
| Refining District Louisiana Gulf Coast Refinery and Blender Net Production of Asphalt and Road Oil (Thousand Barrels) | ||||||||
| Decade | Year-0 | Year-1 | Year-2 | Year-3 | Year-4 | Year-5 | Year-6 | Year-7 | Year-8 | Year-9 |
|---|---|---|---|---|---|---|---|---|---|---|
| 1990's | 12,411 | 9,927 | 10,647 | 10,959 | 12,098 | 12,812 | 12,931 | |||
| 2000's | 13,670 | 13,248 | 11,263 | 10,177 | 9,350 | 10,502 | 10,017 | 8,982 | 7,571 | 7,250 |
| 2010's | 6,655 | 3,575 | 5,561 | 5,751 | 7,073 | 10,200 | 9,685 | 11,493 | 9,706 | 8,850 |
| 2020's | 8,059 | 9,191 | 7,837 | 6,103 |
| - = No Data Reported; -- = Not Applicable; NA = Not Available; W = Withheld to avoid disclosure of individual company data. |
| Release Date: 8/30/2024 |
| Next Release Date: 8/29/2025 |