|
Download Data (XLS File) |
|
||||||||
|
||||||||
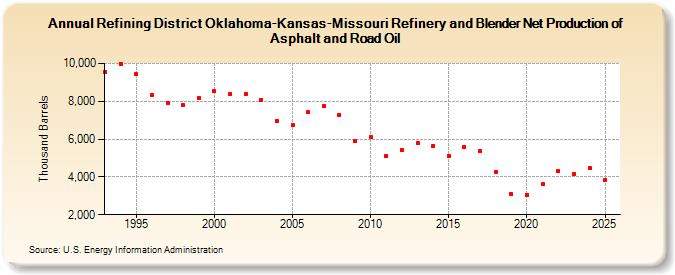
| Refining District Oklahoma-Kansas-Missouri Refinery and Blender Net Production of Asphalt and Road Oil (Thousand Barrels) | ||||||||
| Decade | Year-0 | Year-1 | Year-2 | Year-3 | Year-4 | Year-5 | Year-6 | Year-7 | Year-8 | Year-9 |
|---|---|---|---|---|---|---|---|---|---|---|
| 1990's | 9,573 | 9,987 | 9,458 | 8,311 | 7,910 | 7,780 | 8,186 | |||
| 2000's | 8,524 | 8,377 | 8,396 | 8,092 | 6,933 | 6,732 | 7,413 | 7,745 | 7,298 | 5,890 |
| 2010's | 6,108 | 5,112 | 5,431 | 5,802 | 5,625 | 5,130 | 5,574 | 5,363 | 4,239 | 3,095 |
| 2020's | 3,063 | 3,600 | 4,300 | 4,146 |
| - = No Data Reported; -- = Not Applicable; NA = Not Available; W = Withheld to avoid disclosure of individual company data. |
| Release Date: 3/29/2024 |
| Next Release Date: 8/30/2024 |