|
Download Data (XLS File) |
|
||||||||
|
||||||||
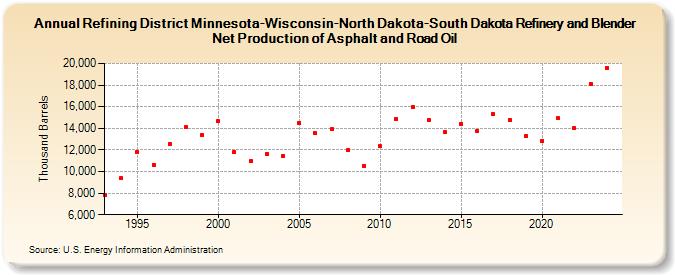
| Refining District Minnesota-Wisconsin-North Dakota-South Dakota Refinery and Blender Net Production of Asphalt and Road Oil (Thousand Barrels) | ||||||||
| Decade | Year-0 | Year-1 | Year-2 | Year-3 | Year-4 | Year-5 | Year-6 | Year-7 | Year-8 | Year-9 |
|---|---|---|---|---|---|---|---|---|---|---|
| 1990's | 7,780 | 9,366 | 11,775 | 10,606 | 12,551 | 14,110 | 13,392 | |||
| 2000's | 14,671 | 11,841 | 10,949 | 11,639 | 11,462 | 14,522 | 13,537 | 13,910 | 12,007 | 10,547 |
| 2010's | 12,318 | 14,843 | 15,992 | 14,757 | 13,642 | 14,423 | 13,789 | 15,293 | 14,810 | 13,308 |
| 2020's | 12,862 | 14,913 | 14,017 | 18,126 |
| - = No Data Reported; -- = Not Applicable; NA = Not Available; W = Withheld to avoid disclosure of individual company data. |
| Release Date: 4/30/2024 |
| Next Release Date: 8/30/2024 |