|
Download Data (XLS File) |
|
||||||||
|
||||||||
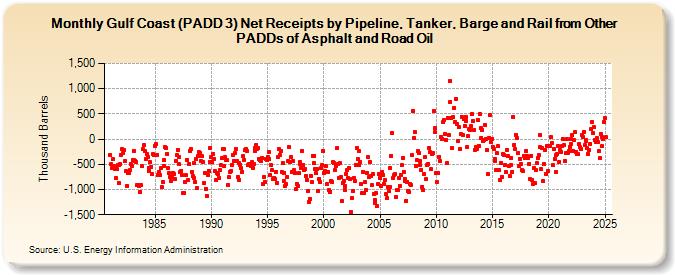
| Gulf Coast (PADD 3) Net Receipts by Pipeline, Tanker, and Barge from Other PADDs of Asphalt and Road Oil (Thousand Barrels) | ||||||||
| Year | Jan | Feb | Mar | Apr | May | Jun | Jul | Aug | Sep | Oct | Nov | Dec |
|---|---|---|---|---|---|---|---|---|---|---|---|---|
| 1981 | -313 | -499 | -583 | -402 | -535 | -600 | -769 | -601 | -519 | -861 | -514 | -495 |
| 1982 | -310 | -200 | -279 | -226 | -430 | -640 | -921 | -669 | -670 | -618 | -497 | -533 |
| 1983 | -418 | -231 | -424 | -432 | -449 | -917 | -915 | -923 | -1,053 | -920 | -537 | -202 |
| 1984 | -121 | -246 | -398 | -301 | -358 | -572 | -634 | -462 | -546 | -698 | -305 | -315 |
| 1985 | -127 | -103 | -309 | -703 | -646 | -715 | -579 | -956 | -844 | -528 | -417 | -164 |
| 1986 | -171 | -292 | -573 | -679 | -744 | -834 | -751 | -666 | -683 | -793 | -427 | -318 |
| 1987 | -208 | -491 | -352 | -662 | -627 | -714 | -1,071 | -1,065 | -846 | -721 | -407 | -806 |
| 1988 | -489 | -237 | -201 | -655 | -727 | -771 | -478 | -852 | -399 | -968 | -338 | -263 |
| 1989 | -269 | -438 | -344 | -451 | -875 | -664 | -982 | -1,125 | -708 | -625 | -451 | -172 |
| 1990 | -348 | -450 | -286 | -389 | -636 | -804 | -663 | -700 | -776 | -615 | -519 | -383 |
| 1991 | -200 | -192 | -534 | -354 | -420 | -424 | -908 | -757 | -645 | -630 | -505 | -307 |
| 1992 | -426 | -282 | -198 | -443 | -743 | -473 | -810 | -505 | -583 | -649 | -343 | -410 |
| 1993 | -213 | -192 | -232 | -519 | -498 | -511 | -525 | -464 | -577 | -491 | -245 | -184 |
| 1994 | -110 | -189 | -175 | -387 | -413 | -427 | -377 | -881 | -745 | -851 | -393 | -419 |
| 1995 | -350 | -259 | -396 | -711 | -523 | -621 | -792 | -765 | -797 | -644 | -861 | -357 |
| 1996 | -195 | -314 | -241 | -643 | -473 | -827 | -673 | -930 | -896 | -751 | -437 | -164 |
| 1997 | -453 | -359 | -644 | -431 | -621 | -670 | -995 | -884 | -925 | -682 | -445 | -499 |
| 1998 | -567 | -233 | -509 | -607 | -599 | -726 | -810 | -1,030 | -1,246 | -1,181 | -737 | -848 |
| 1999 | -327 | -473 | -326 | -585 | -681 | -598 | -1,026 | -785 | -854 | -575 | -510 | -229 |
| 2000 | -668 | -641 | -540 | -892 | -653 | -1,011 | -1,055 | -1,046 | -826 | -845 | -461 | -474 |
| 2001 | -620 | -537 | -183 | -490 | -769 | -483 | -753 | -1,236 | -868 | -825 | -1,000 | -927 |
| 2002 | -690 | -613 | -772 | -580 | -783 | -1,451 | -1,167 | -1,024 | -771 | -831 | -506 | -167 |
| 2003 | -393 | -233 | -523 | -456 | -888 | -1,077 | -643 | -1,070 | -858 | -1,007 | -666 | -353 |
| 2004 | -756 | -450 | -723 | -920 | -688 | -1,093 | -1,218 | -1,276 | -1,072 | -1,336 | -883 | -693 |
| 2005 | -762 | -932 | -643 | -704 | -886 | -809 | -1,096 | -1,169 | -943 | -1,027 | -950 | -569 |
| 2006 | -327 | 121 | -762 | -718 | -690 | -1,148 | -1,000 | -1,014 | -769 | -926 | -706 | -515 |
| 2007 | -374 | -645 | -782 | -831 | -1,222 | -842 | -1,035 | -1,050 | -881 | -909 | -321 | 555 |
| 2008 | 29 | 131 | -525 | -415 | -242 | -272 | -439 | -513 | -608 | -943 | -1,007 | -692 |
| 2009 | -361 | -798 | -522 | -489 | -173 | -257 | -599 | -295 | -273 | 557 | 211 | 133 |
| 2010 | -679 | -858 | -673 | -346 | -442 | 50 | 5 | 332 | 374 | 98 | -8 | -484 |
| 2011 | 425 | 79 | 1,152 | 742 | 417 | -180 | 433 | 617 | 340 | 799 | 304 | -33 |
| 2012 | 237 | -201 | 100 | 448 | 73 | 392 | 263 | 446 | 359 | -152 | 58 | 191 |
| 2013 | 188 | 252 | 507 | 357 | 181 | -210 | -160 | -206 | 386 | -128 | 502 | 213 |
| 2014 | 25 | 184 | -44 | -11 | 277 | -7 | -208 | -701 | 29 | 476 | -65 | 8 |
| 2015 | -148 | -204 | -390 | -428 | -617 | -283 | -146 | -615 | -816 | -479 | -745 | -295 |
| 2016 | -314 | -517 | -655 | -207 | -344 | -529 | -729 | -514 | -377 | -646 | 440 | -109 |
| 2017 | -201 | 91 | 14 | -271 | -540 | -387 | -491 | -617 | -636 | -335 | -369 | -344 |
| 2018 | -233 | -342 | -369 | -489 | -793 | -329 | -809 | -895 | -565 | -867 | -621 | -483 |
| 2019 | -375 | -323 | -165 | 84 | -595 | -184 | -841 | -494 | -208 | -684 | -137 | -626 |
| 2020 | -133 | -139 | 35 | -79 | -516 | -195 | -401 | -658 | -318 | -295 | -145 | -447 |
| 2021 | -224 | -253 | -143 | -4 | -125 | -432 | -271 | -3 | -276 | -240 | -160 | -105 |
| 2022 | 4 | 72 | -231 | -24 | 136 | -251 | -300 | -305 | -95 | -166 | -187 | 86 |
| 2023 | 49 | 146 | -125 | -15 | -35 | -182 | -296 | -221 | -96 | 196 | 336 | 121 |
| 2024 | 218 | |||||||||||
| - = No Data Reported; -- = Not Applicable; NA = Not Available; W = Withheld to avoid disclosure of individual company data. |
| Release Date: 3/29/2024 |
| Next Release Date: 4/30/2024 |