|
Download Data (XLS File) |
|
||||||||
|
||||||||
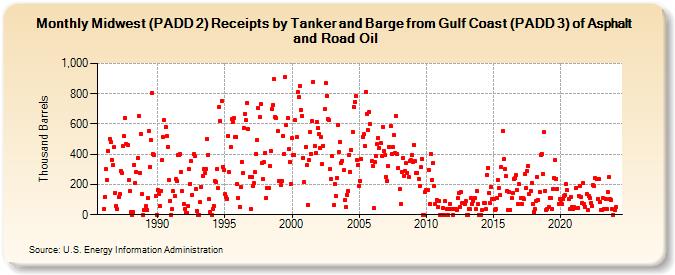
| Midwest (PADD 2) Receipts by Tanker and Barge from Gulf Coast (PADD 3) of Asphalt and Road Oil (Thousand Barrels) | ||||||||
| Year | Jan | Feb | Mar | Apr | May | Jun | Jul | Aug | Sep | Oct | Nov | Dec |
|---|---|---|---|---|---|---|---|---|---|---|---|---|
| 1986 | 38 | 119 | 299 | 232 | 421 | 501 | 480 | 365 | 328 | 445 | 145 | 58 |
| 1987 | 35 | 114 | 134 | 286 | 277 | 454 | 518 | 640 | 468 | 464 | 227 | 154 |
| 1988 | 15 | 0 | 15 | 330 | 212 | 284 | 375 | 654 | 279 | 533 | 137 | 0 |
| 1989 | 34 | 55 | 34 | 112 | 556 | 317 | 494 | 807 | 401 | 398 | 127 | 0 |
| 1990 | 164 | 139 | 57 | 159 | 363 | 515 | 623 | 582 | 523 | 451 | 231 | 89 |
| 1991 | 0 | 35 | 155 | 124 | 233 | 224 | 392 | 397 | 401 | 285 | 154 | 70 |
| 1992 | 39 | 14 | 14 | 58 | 300 | 206 | 353 | 133 | 399 | 385 | 167 | 27 |
| 1993 | 0 | 0 | 83 | 185 | 257 | 303 | 273 | 303 | 502 | 398 | 104 | 16 |
| 1994 | 0 | 41 | 56 | 220 | 217 | 302 | 174 | 715 | 621 | 752 | 318 | 296 |
| 1995 | 135 | 120 | 106 | 523 | 280 | 445 | 631 | 614 | 638 | 513 | 515 | 203 |
| 1996 | 112 | 52 | 183 | 351 | 273 | 576 | 667 | 623 | 740 | 565 | 250 | 37 |
| 1997 | 252 | 188 | 207 | 280 | 403 | 494 | 704 | 644 | 729 | 340 | 233 | 346 |
| 1998 | 410 | 112 | 176 | 178 | 321 | 420 | 698 | 726 | 896 | 648 | 639 | 553 |
| 1999 | 222 | 225 | 197 | 222 | 522 | 403 | 912 | 591 | 642 | 432 | 347 | 202 |
| 2000 | 506 | 394 | 397 | 623 | 513 | 809 | 776 | 851 | 695 | 656 | 377 | 216 |
| 2001 | 449 | 328 | 67 | 360 | 544 | 404 | 620 | 878 | 453 | 405 | 616 | 575 |
| 2002 | 533 | 439 | 513 | 338 | 457 | 697 | 868 | 786 | 630 | 623 | 303 | 235 |
| 2003 | 387 | 64 | 202 | 127 | 246 | 596 | 416 | 481 | 343 | 357 | 295 | 96 |
| 2004 | 48 | 133 | 157 | 398 | 285 | 427 | 548 | 713 | 746 | 782 | 361 | 332 |
| 2005 | 193 | 224 | 366 | 515 | 531 | 452 | 813 | 666 | 560 | 680 | 600 | 355 |
| 2006 | 325 | 42 | 346 | 388 | 466 | 507 | 442 | 477 | 388 | 583 | 419 | 393 |
| 2007 | 252 | 224 | 323 | 449 | 585 | 401 | 448 | 527 | 411 | 653 | 401 | 310 |
| 2008 | 168 | 70 | 283 | 373 | 255 | 287 | 339 | 279 | 247 | 355 | 362 | 397 |
| 2009 | 348 | 464 | 355 | 275 | 276 | 238 | 187 | 314 | 368 | 0 | 0 | 150 |
| 2010 | 163 | 162 | 298 | 73 | 403 | 232 | 342 | 190 | 71 | 99 | 51 | 88 |
| 2011 | 0 | 0 | 0 | 45 | 0 | 89 | 36 | 0 | 36 | 73 | 37 | 36 |
| 2012 | 0 | 37 | 37 | 34 | 109 | 142 | 52 | 147 | 76 | 79 | 69 | 89 |
| 2013 | 0 | 0 | 38 | 36 | 111 | 72 | 92 | 111 | 37 | 157 | 70 | 0 |
| 2014 | 0 | 0 | 31 | 77 | 77 | 35 | 262 | 312 | 145 | 75 | 184 | 107 |
| 2015 | 107 | 33 | 36 | 111 | 227 | 174 | 130 | 313 | 553 | 366 | 300 | 256 |
| 2016 | 160 | 33 | 150 | 34 | 111 | 146 | 238 | 240 | 260 | 166 | 69 | 200 |
| 2017 | 112 | 71 | 111 | 106 | 268 | 178 | 292 | 322 | 137 | 160 | 213 | 74 |
| 2018 | 17 | 37 | 89 | 248 | 98 | 148 | 396 | 404 | 271 | 544 | 157 | 33 |
| 2019 | 40 | 50 | 109 | 111 | 35 | 173 | 245 | 360 | 239 | 172 | 70 | 107 |
| 2020 | 75 | 69 | 105 | 122 | 130 | 201 | 161 | 103 | 36 | 117 | 54 | 35 |
| 2021 | 50 | 43 | 179 | 47 | 124 | 190 | 117 | 80 | 210 | 68 | 54 | 136 |
| 2022 | 34 | 123 | 112 | 79 | 56 | 194 | 192 | 241 | 233 | 106 | 237 | 81 |
| 2023 | 33 | 34 | 111 | 36 | 107 | 37 | 150 | 249 | 101 | 99 | 35 | 0 |
| 2024 | 34 | |||||||||||
| - = No Data Reported; -- = Not Applicable; NA = Not Available; W = Withheld to avoid disclosure of individual company data. |
| Release Date: 3/29/2024 |
| Next Release Date: 4/30/2024 |