|
Download Data (XLS File) |
|
||||||||
|
||||||||
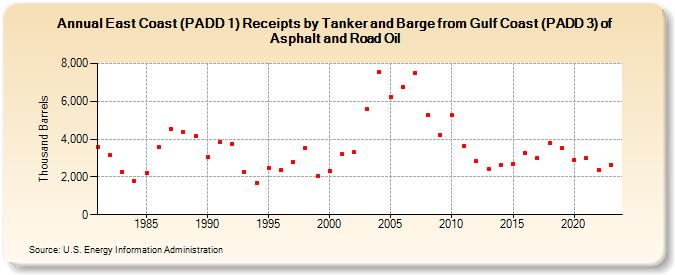
| East Coast (PADD 1) Receipts by Tanker and Barge from Gulf Coast (PADD 3) of Asphalt and Road Oil (Thousand Barrels) | ||||||||
| Decade | Year-0 | Year-1 | Year-2 | Year-3 | Year-4 | Year-5 | Year-6 | Year-7 | Year-8 | Year-9 |
|---|---|---|---|---|---|---|---|---|---|---|
| 1980's | 3,587 | 3,138 | 2,281 | 1,791 | 2,216 | 3,565 | 4,552 | 4,358 | 4,141 | |
| 1990's | 3,073 | 3,845 | 3,751 | 2,263 | 1,703 | 2,461 | 2,365 | 2,788 | 3,516 | 2,052 |
| 2000's | 2,333 | 3,220 | 3,301 | 5,569 | 7,529 | 6,245 | 6,781 | 7,521 | 5,297 | 4,200 |
| 2010's | 5,257 | 3,650 | 2,839 | 2,428 | 2,611 | 2,659 | 3,242 | 2,991 | 3,819 | 3,540 |
| 2020's | 2,914 | 2,993 | 2,378 | 2,652 |
| - = No Data Reported; -- = Not Applicable; NA = Not Available; W = Withheld to avoid disclosure of individual company data. |
| Release Date: 8/30/2024 |
| Next Release Date: 8/29/2025 |