|
Download Data (XLS File) |
|
||||||||
|
||||||||
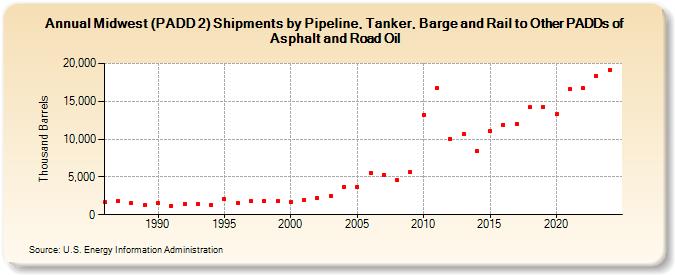
| Midwest (PADD 2) Shipments by Pipeline, Tanker, Barge and Rail to Other PADDs of Asphalt and Road Oil (Thousand Barrels) | ||||||||
| Decade | Year-0 | Year-1 | Year-2 | Year-3 | Year-4 | Year-5 | Year-6 | Year-7 | Year-8 | Year-9 |
|---|---|---|---|---|---|---|---|---|---|---|
| 1980's | 1,629 | 1,845 | 1,556 | 1,263 | ||||||
| 1990's | 1,516 | 1,208 | 1,439 | 1,471 | 1,320 | 2,046 | 1,606 | 1,754 | 1,814 | 1,811 |
| 2000's | 1,702 | 1,947 | 2,221 | 2,477 | 3,693 | 3,719 | 5,550 | 5,287 | 4,569 | 5,644 |
| 2010's | 13,244 | 16,704 | 10,062 | 10,651 | 8,397 | 11,096 | 11,905 | 12,046 | 14,189 | 14,261 |
| 2020's | 13,281 | 16,579 | 16,722 | 18,328 |
| - = No Data Reported; -- = Not Applicable; NA = Not Available; W = Withheld to avoid disclosure of individual company data. |
| Release Date: 8/30/2024 |
| Next Release Date: 8/29/2025 |