|
Download Data (XLS File) |
|
||||||||
|
||||||||
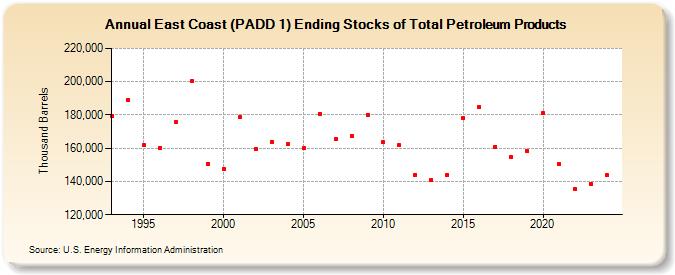
| East Coast (PADD 1) Ending Stocks of Total Petroleum Products (Thousand Barrels) | ||||||||
| Decade | Year-0 | Year-1 | Year-2 | Year-3 | Year-4 | Year-5 | Year-6 | Year-7 | Year-8 | Year-9 |
|---|---|---|---|---|---|---|---|---|---|---|
| 1990's | 179,216 | 188,886 | 161,788 | 160,326 | 175,962 | 200,425 | 150,668 | |||
| 2000's | 147,688 | 178,611 | 159,643 | 163,749 | 162,291 | 159,895 | 180,758 | 165,329 | 167,370 | 180,136 |
| 2010's | 163,497 | 161,864 | 144,061 | 140,989 | 143,956 | 178,158 | 184,671 | 160,806 | 154,507 | 158,326 |
| 2020's | 181,194 | 150,423 | 135,213 | 138,749 |
| - = No Data Reported; -- = Not Applicable; NA = Not Available; W = Withheld to avoid disclosure of individual company data. |
| Release Date: 8/30/2024 |
| Next Release Date: 8/29/2025 |