|
Download Data (XLS File) |
|
||||||||
|
||||||||
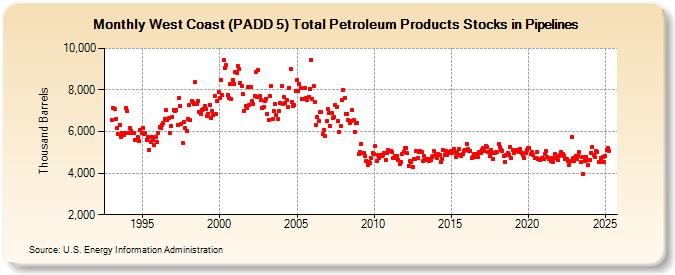
| West Coast (PADD 5) Total Petroleum Products Stocks in Pipelines (Thousand Barrels) | ||||||||
| Year | Jan | Feb | Mar | Apr | May | Jun | Jul | Aug | Sep | Oct | Nov | Dec |
|---|---|---|---|---|---|---|---|---|---|---|---|---|
| 1993 | 6,536 | 7,152 | 7,062 | 6,595 | 6,180 | 5,866 | 6,312 | 5,749 | 5,909 | 5,824 | 5,925 | 7,154 |
| 1994 | 6,997 | 5,929 | 6,175 | 6,043 | 5,925 | 5,938 | 5,596 | 5,591 | 5,724 | 5,541 | 6,061 | 5,929 |
| 1995 | 6,186 | 5,901 | 5,918 | 5,613 | 5,738 | 5,121 | 5,510 | 5,761 | 5,609 | 5,362 | 5,747 | 5,518 |
| 1996 | 5,945 | 6,214 | 6,157 | 6,316 | 6,421 | 6,597 | 7,020 | 6,549 | 6,629 | 5,935 | 6,263 | 6,688 |
| 1997 | 7,033 | 7,004 | 7,056 | 6,305 | 7,633 | 7,237 | 6,344 | 5,469 | 6,477 | 6,157 | 6,014 | 6,622 |
| 1998 | 7,263 | 6,536 | 7,450 | 7,403 | 7,317 | 8,362 | 7,333 | 7,476 | 6,933 | 6,860 | 7,031 | 7,083 |
| 1999 | 7,242 | 7,098 | 6,741 | 6,845 | 7,286 | 6,654 | 6,967 | 6,787 | 7,718 | 6,827 | 7,459 | 7,898 |
| 2000 | 7,609 | 8,493 | 7,762 | 9,460 | 9,074 | 9,178 | 7,752 | 7,623 | 8,291 | 7,546 | 8,473 | 8,310 |
| 2001 | 8,865 | 8,829 | 9,136 | 9,007 | 8,321 | 8,210 | 7,808 | 6,994 | 7,247 | 7,134 | 8,146 | 7,270 |
| 2002 | 8,150 | 7,485 | 7,307 | 7,717 | 8,845 | 7,685 | 8,950 | 7,687 | 7,500 | 7,129 | 7,200 | 7,473 |
| 2003 | 7,581 | 6,844 | 6,579 | 7,713 | 8,188 | 6,586 | 6,977 | 7,308 | 6,779 | 6,584 | 6,976 | 7,385 |
| 2004 | 8,173 | 7,315 | 7,659 | 7,396 | 7,528 | 7,157 | 8,109 | 9,012 | 7,441 | 7,219 | 7,283 | 7,939 |
| 2005 | 8,476 | 7,954 | 8,306 | 8,084 | 7,572 | 7,583 | 8,099 | 7,595 | 7,533 | 7,667 | 8,068 | 9,452 |
| 2006 | 7,580 | 8,187 | 7,417 | 6,309 | 6,699 | 6,505 | 6,925 | 6,947 | 5,865 | 6,087 | 5,763 | 6,492 |
| 2007 | 7,063 | 6,894 | 6,286 | 6,894 | 6,668 | 6,697 | 7,263 | 7,180 | 6,527 | 5,990 | 6,270 | 7,494 |
| 2008 | 8,011 | 7,631 | 6,859 | 6,858 | 6,547 | 6,399 | 6,493 | 7,019 | 6,555 | 5,988 | 6,433 | 6,424 |
| 2009 | 4,908 | 5,038 | 5,403 | 4,948 | 4,973 | 4,813 | 4,588 | 4,377 | 4,512 | 4,480 | 4,707 | 4,985 |
| 2010 | 4,919 | 5,294 | 4,605 | 4,859 | 4,747 | 4,883 | 4,801 | 4,869 | 4,947 | 4,655 | 4,983 | 5,102 |
| 2011 | 5,086 | 5,078 | 5,001 | 4,747 | 4,822 | 4,719 | 4,812 | 4,641 | 4,461 | 4,544 | 4,914 | 5,005 |
| 2012 | 5,205 | 5,225 | 4,949 | 4,340 | 4,583 | 4,558 | 4,307 | 4,680 | 4,689 | 5,042 | 4,726 | 5,017 |
| 2013 | 5,051 | 5,037 | 4,583 | 4,823 | 4,660 | 4,637 | 4,684 | 4,595 | 4,649 | 4,757 | 4,848 | 5,051 |
| 2014 | 4,887 | 4,727 | 4,925 | 4,894 | 4,530 | 4,683 | 5,123 | 4,889 | 5,073 | 4,870 | 5,020 | 4,955 |
| 2015 | 5,057 | 4,975 | 5,143 | 5,005 | 4,793 | 4,970 | 5,154 | 4,874 | 4,810 | 4,935 | 5,072 | 5,098 |
| 2016 | 5,420 | 5,139 | 5,047 | 5,084 | 4,724 | 4,771 | 4,932 | 4,797 | 4,943 | 4,761 | 5,026 | 4,968 |
| 2017 | 5,106 | 5,222 | 5,061 | 5,323 | 5,269 | 4,995 | 4,809 | 5,111 | 4,978 | 4,663 | 4,974 | 5,011 |
| 2018 | 5,006 | 5,403 | 5,239 | 5,126 | 5,072 | 4,839 | 4,546 | 4,891 | 4,967 | 4,892 | 5,263 | 4,715 |
| 2019 | 5,126 | 4,950 | 5,042 | 5,092 | 5,067 | 5,027 | 5,140 | 4,947 | 4,878 | 4,738 | 4,960 | 5,132 |
| 2020 | 5,185 | 5,192 | 4,941 | 5,008 | 4,851 | 4,723 | 4,727 | 5,009 | 4,695 | 4,648 | 4,673 | 4,746 |
| 2021 | 4,676 | 4,907 | 5,050 | 4,763 | 4,669 | 4,746 | 4,575 | 4,544 | 4,716 | 4,935 | 4,743 | 4,629 |
| 2022 | 4,847 | 4,879 | 5,035 | 4,901 | 4,839 | 4,658 | 4,686 | 4,572 | 4,401 | 4,599 | 5,736 | 4,723 |
| 2023 | 4,605 | 4,838 | 4,691 | 4,816 | 5,023 | 4,532 | 4,757 | 3,947 | 4,573 | 4,889 | 4,651 | 4,380 |
| 2024 | 4,650 | |||||||||||
| - = No Data Reported; -- = Not Applicable; NA = Not Available; W = Withheld to avoid disclosure of individual company data. |
| Release Date: 3/29/2024 |
| Next Release Date: 4/30/2024 |