|
Download Data (XLS File) |
|
||||||||
|
||||||||
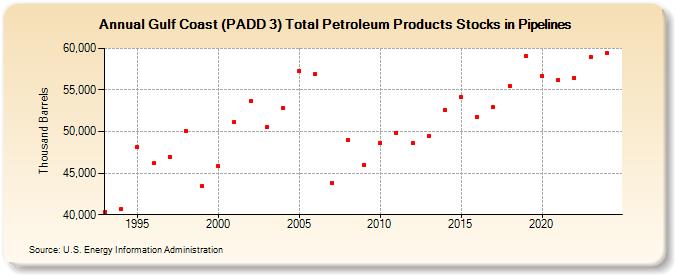
| Gulf Coast (PADD 3) Total Petroleum Products Stocks in Pipelines (Thousand Barrels) | ||||||||
| Decade | Year-0 | Year-1 | Year-2 | Year-3 | Year-4 | Year-5 | Year-6 | Year-7 | Year-8 | Year-9 |
|---|---|---|---|---|---|---|---|---|---|---|
| 1990's | 40,345 | 40,705 | 48,109 | 46,169 | 46,989 | 50,126 | 43,463 | |||
| 2000's | 45,838 | 51,202 | 53,652 | 50,513 | 52,845 | 57,306 | 56,865 | 43,849 | 49,034 | 45,994 |
| 2010's | 48,675 | 49,878 | 48,624 | 49,429 | 52,581 | 54,137 | 51,759 | 52,935 | 55,515 | 59,086 |
| 2020's | 56,733 | 56,244 | 56,497 | 59,770 |
| - = No Data Reported; -- = Not Applicable; NA = Not Available; W = Withheld to avoid disclosure of individual company data. |
| Release Date: 6/28/2024 |
| Next Release Date: 8/30/2024 |