|
Download Data (XLS File) |
|
||||||||
|
||||||||
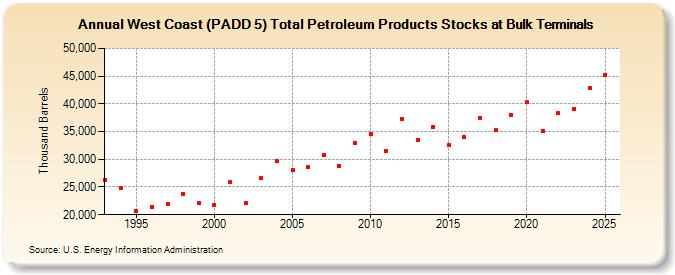
| West Coast (PADD 5) Total Petroleum Products Stocks at Bulk Terminals (Thousand Barrels) | ||||||||
| Decade | Year-0 | Year-1 | Year-2 | Year-3 | Year-4 | Year-5 | Year-6 | Year-7 | Year-8 | Year-9 |
|---|---|---|---|---|---|---|---|---|---|---|
| 1990's | 26,315 | 24,772 | 20,666 | 21,370 | 21,917 | 23,763 | 22,154 | |||
| 2000's | 21,814 | 25,840 | 22,052 | 26,569 | 29,682 | 28,051 | 28,526 | 30,770 | 28,749 | 32,877 |
| 2010's | 34,608 | 31,507 | 37,285 | 33,478 | 35,880 | 32,567 | 33,956 | 37,378 | 35,194 | 37,908 |
| 2020's | 40,252 | 35,059 | 38,279 | 39,089 |
| - = No Data Reported; -- = Not Applicable; NA = Not Available; W = Withheld to avoid disclosure of individual company data. |
| Release Date: 8/30/2024 |
| Next Release Date: 8/29/2025 |