|
Download Data (XLS File) |
|
||||||||
|
||||||||
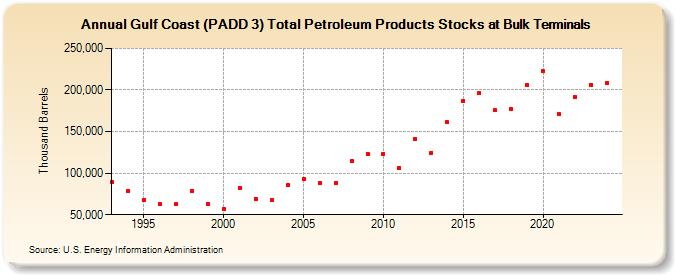
| Gulf Coast (PADD 3) Total Petroleum Products Stocks at Bulk Terminals (Thousand Barrels) | ||||||||
| Decade | Year-0 | Year-1 | Year-2 | Year-3 | Year-4 | Year-5 | Year-6 | Year-7 | Year-8 | Year-9 |
|---|---|---|---|---|---|---|---|---|---|---|
| 1990's | 88,923 | 78,077 | 67,666 | 62,645 | 62,365 | 78,647 | 63,417 | |||
| 2000's | 57,240 | 82,066 | 69,492 | 67,370 | 85,550 | 92,682 | 87,571 | 87,771 | 114,846 | 123,500 |
| 2010's | 123,403 | 106,195 | 140,959 | 124,748 | 161,058 | 187,302 | 196,810 | 175,876 | 176,629 | 206,068 |
| 2020's | 222,313 | 170,945 | 192,126 | 207,147 |
| - = No Data Reported; -- = Not Applicable; NA = Not Available; W = Withheld to avoid disclosure of individual company data. |
| Release Date: 3/29/2024 |
| Next Release Date: 8/30/2024 |