|
Download Data (XLS File) |
|
||||||||
|
||||||||
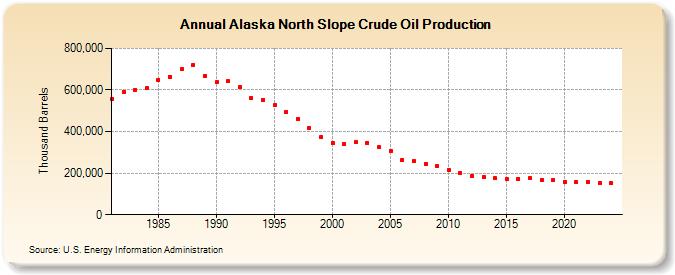
| Alaska North Slope Crude Oil Production (Thousand Barrels) | ||||||||
| Decade | Year-0 | Year-1 | Year-2 | Year-3 | Year-4 | Year-5 | Year-6 | Year-7 | Year-8 | Year-9 |
|---|---|---|---|---|---|---|---|---|---|---|
| 1980's | 556,265 | 591,506 | 600,758 | 608,418 | 649,287 | 663,736 | 699,807 | 722,447 | 668,612 | |
| 1990's | 636,165 | 641,007 | 612,119 | 563,647 | 553,406 | 526,139 | 495,416 | 460,715 | 417,050 | 372,281 |
| 2000's | 344,605 | 339,914 | 348,079 | 345,566 | 324,216 | 308,277 | 264,244 | 258,107 | 245,124 | 232,759 |
| 2010's | 215,138 | 201,092 | 188,322 | 182,499 | 174,529 | 169,542 | 173,735 | 175,275 | 169,238 | 164,737 |
| 2020's | 159,433 | 156,161 | 156,169 | 152,342 |
| - = No Data Reported; -- = Not Applicable; NA = Not Available; W = Withheld to avoid disclosure of individual company data. |
| Release Date: 3/29/2024 |
| Next Release Date: 8/30/2024 |
Referring Pages: