|
Download Data (XLS File) |
|
|||||
|
|||||
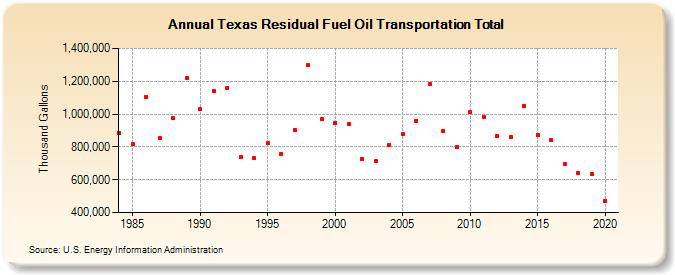
| Texas Residual Fuel Oil Transportation Total (Thousand Gallons) | |||||
| Decade | Year-0 | Year-1 | Year-2 | Year-3 | Year-4 | Year-5 | Year-6 | Year-7 | Year-8 | Year-9 |
|---|---|---|---|---|---|---|---|---|---|---|
| 1980's | 886,431 | 814,825 | 1,106,344 | 852,882 | 975,822 | 1,218,266 | ||||
| 1990's | 1,028,863 | 1,141,394 | 1,157,054 | 739,532 | 730,058 | 820,905 | 756,807 | 902,426 | 1,298,719 | 967,896 |
| 2000's | 947,027 | 938,030 | 725,022 | 712,074 | 812,161 | 876,928 | 959,238 | 1,183,455 | 897,312 | 800,362 |
| 2010's | 1,010,616 | 983,846 | 866,137 | 858,831 | 1,048,514 | 875,313 | 840,098 | 693,016 | 643,787 | 634,267 |
| 2020's | 471,146 |
| - = No Data Reported; -- = Not Applicable; NA = Not Available; W = Withheld to avoid disclosure of individual company data. |
| Release Date: 2/9/2022 |
| Next Release Date: Suspended |