|
Download Data (XLS File) |
|
|||||
|
|||||
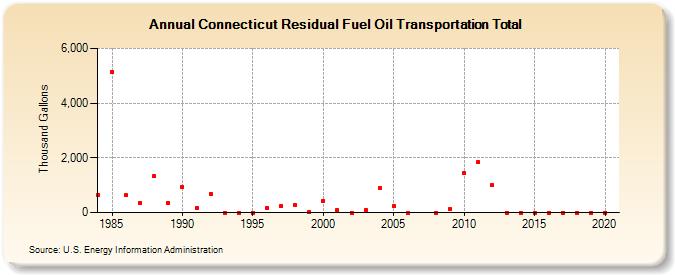
| Connecticut Residual Fuel Oil Transportation Total (Thousand Gallons) | |||||
| Decade | Year-0 | Year-1 | Year-2 | Year-3 | Year-4 | Year-5 | Year-6 | Year-7 | Year-8 | Year-9 |
|---|---|---|---|---|---|---|---|---|---|---|
| 1980's | 633 | 5,131 | 632 | 366 | 1,325 | 341 | ||||
| 1990's | 935 | 175 | 681 | 0 | 0 | 0 | 174 | 238 | 260 | 24 |
| 2000's | 428 | 82 | 0 | 93 | 888 | 237 | 0 | -- | 0 | 126 |
| 2010's | 1,454 | 1,840 | 1,000 | 0 | 0 | 0 | 0 | 0 | 0 | 0 |
| 2020's | 0 |
| - = No Data Reported; -- = Not Applicable; NA = Not Available; W = Withheld to avoid disclosure of individual company data. |
| Release Date: 2/9/2022 |
| Next Release Date: Suspended |